|
Metabarcoding and Metagenomics :
Research Article
|
|
Corresponding author: Masayuki Ushio (ong8181@gmail.com)
Academic editor: Andrew R. Mahon
Received: 28 Dec 2017 | Accepted: 21 Feb 2018 | Published: 14 Mar 2018
© 2018 Masayuki Ushio, Hiroaki Murakami, Reiji Masuda, Tetsuya Sado, Masaki Miya, Sho Sakurai, Hiroki Yamanaka, Toshifumi Minamoto, Michio Kondoh
This is an open access article distributed under the terms of the Creative Commons Attribution License (CC BY 4.0), which permits unrestricted use, distribution, and reproduction in any medium, provided the original author and source are credited.
Citation:
Ushio M, Murakami H, Masuda R, Sado T, Miya M, Sakurai S, Yamanaka H, Minamoto T, Kondoh M (2018) Quantitative monitoring of multispecies fish environmental DNA using high-throughput sequencing. Metabarcoding and Metagenomics 2: e23297. https://doi.org/10.3897/mbmg.2.23297
|
|
Abstract
Effective ecosystem conservation and resource management require quantitative monitoring of biodiversity, including accurate descriptions of species composition and temporal variations of species abundance. Accordingly, quantitative monitoring of biodiversity has been performed for many ecosystems, but it is often time- and effort-consuming and costly. Recent studies have shown that environmental DNA (eDNA), which is released to the environment from macro-organisms living in a habitat, contains information about species identity and abundance. Thus, analysing eDNA would be a promising approach for more efficient biodiversity monitoring. In the present study, internal standard DNAs (i.e. known amounts of short DNA fragments from fish species that have never been observed in a sampling area) were added to eDNA samples, which were collected weekly from a coastal marine ecosystem in Maizuru Bay, Japan (from April 2015 to March 2016) and metabarcoding analysis was performed using Illumina MiSeq to simultaneously identify fish species and quantify fish eDNA copy numbers. A correction equation was obtained for each sample using the relationship between the number of sequence reads and the added amount of the standard DNAs and this equation was used to estimate the copy numbers from the sequence reads of non-standard fish eDNA. The calculated copy numbers showed significant positive correlations with those determined by quantitative PCR, suggesting that eDNA metabarcoding with standard DNA enabled useful quantification of eDNA. Furthermore, for samples that show a high level of PCR inhibition, this method might allow more accurate quantification than qPCR because the correction equations generated using internal standard DNAs would include the effect of PCR inhibition. A single run of Illumina MiSeq produced >70 quantitative fish eDNA time series in this study, showing that this method could contribute to more efficient and quantitative monitoring of biodiversity.
Keywords
biodiversity monitoring; environmental DNA; DNA quantification; internal standard DNA; qPCR; metabarcoding
Introduction
Effective ecosystem conservation and resource management require quantitative monitoring of biodiversity, including accurate descriptions of species composition and temporal variations of species abundance. Accordingly, quantitative monitoring of biodiversity has often been performed for many ecosystems. For example, fishing (in aquatic ecosystems), the camera/video trap method (in terrestrial ecosystems) and direct visual census (in aquatic and terrestrial ecosystems) have traditionally been used as tools for biodiversity monitoring (see, for example,
Environmental DNA (eDNA), which designates DNA isolated from environmental samples (e.g. water or soil) without sampling target (macro-)organism(s), has been used to detect the presence of macro-organisms, particularly those living in an aquatic environment (e.g.
Though the eDNA metabarcoding approach has greatly improved the efficiency of biodiversity monitoring, several potential limitations prevent its use as a tool for quantitative monitoring of biodiversity. First, whether the quantity of eDNA is a reliable index of the abundance (or biomass) of macro-organisms is still challenging despite many reports of positive correlations between them (
Regarding the first issue, some studies showed that the eDNA quantity could be a proxy for the abundance or biomass of macro-organisms under particular conditions such as tank and mesocosm experiments (e.g.
Regarding the second issue, some potential approaches to solve this problem have been reported in the field of microbial ecology. For example,
In the present study, we focused on the second issue (i.e. the quantification of eDNA using high-throughput sequencing) and did not explicitly try to resolve the first issue (i.e. the accurate estimation of species abundance/biomass based on eDNA quantity), because at present various biotic/abiotic factors at fine spatiotemporal resolutions, for some of which data are not currently available in the study region, should be incorporated to resolve this first issue (e.g.
Material and methods
Study site
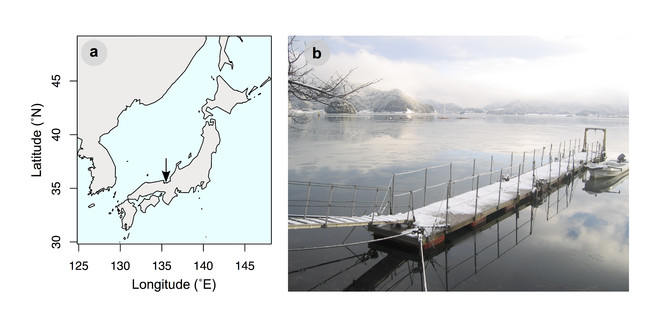
Water samples were collected at a floating pier in the Maizuru Fishery Research Station of Kyoto University (Nagahama, Maizuru, Kyoto, Japan: 35˚29´24.66" N, 135˚22´5.76" E; Fig.
Water sampling and DNA extraction
All sampling and filtering equipment was washed with a 10% commercial bleach solution before use. One thousand millilitres of seawater were collected once a week from 7 April 2015 to 29 March 2016 from a pier (Fig.
DNA was extracted from the filters using a DNeasy Blood and Tissue Kit (Qiagen, Hilden, Germany) in combination with a spin column (EZ-10; Bio Basic, Markham, Ontario, Canada). After removal of the attached membrane from the spin column (EZ-10), the filter was tightly folded into a small cylindrical shape and placed in the spin column. The spin column was centrifuged at 6,000 g for 1 min to remove excess water from the filter. The column was then placed in the same 2-ml tube and subjected to cell lysis using proteinase K. For the lysis, sterilised H2O (200 µl), proteinase K (10 µl) and buffer AL (100 µl) were mixed and the mixed solution was gently pipetted on to the folded filter in the spin column. The column was then placed on a 56˚C preheated aluminium heat block and incubated for 30 min. After the incubation, the spin column was centrifuged at 6,000 g for 1 min to collect DNA. In order to increase the yield of DNA from the filter, 200 µl of sterilised TE buffer was gently pipetted on to the folded filter and the spin column was again centrifuged at 6,000 g for 1 min. The collected DNA solution (about 500 µl) was purified using a DNeasy Blood and Tissue Kit following the manufacturer’s protocol. After the purification steps, DNA was eluted with the elution buffer (100 µl) provided in the kit.
Preparation of standard fish DNAs
Extracted DNAs of five fish species, Saurogobio immaculatus Koller, 1927, Elopichthys bambusa (Richardson, 1845), Carassioides acuminatus (Richardson, 1846), Labeo coubie Rüeppell, 1832 and Acanthopsoides gracilentus (Smith, 1945), that are all freshwater fishes from Southeast Asia or Africa and have never occurred in the sampling region, were used as internal standard DNAs. A target region (mitochondrial 12S rRNA) of the extracted DNA was amplified using MiFish primers (without MiSeq adaptors) (
Paired-end library preparation
Work-spaces and equipment were sterilised prior to the library preparation, filtered pipette tips were used and separate rooms were used for pre- and post-PCR operations to safeguard against cross-contamination. Negative controls were also employed to monitor contamination during the experiments. A fish universal primer set (MiFish primers;
The first-round PCR (1st PCR) was carried out with a 12-µl reaction volume containing 6.0 µl of 2 × KAPA HiFi HotStart ReadyMix (KAPA Biosystems, Wilmington, WA, USA), 0.7 µl of each primer (5 µM), 0.6 µl of sterilised distilled H2O, 2 µl of standard DNA mix and 2.0 µl of template. Note that the standard DNA mix was included for each sample. The final concentration of each primer was 0.3 µM. The sequences of MiFish primers are: GTCGGTAAAACTCGTGCCAGC (MiFish-U-F) and CATAGTGGGGTATCTAATCCCAGTTTG (MiFish-U-R) (
The second-round PCR (2nd PCR) was carried out with a 24-µl reaction volume containing 12 µl of 2 × KAPA HiFi HotStart ReadyMix, 1.4 µl of each primer (5 µM), 7.2 µl of sterilised distilled H2O and 2.0 µl of template. Different combinations of forward and reverse indices were used for different templates (samples) for massively parallel sequencing with MiSeq (Suppl. material
Sequence read processing and taxonomic assignment
The detailed information about the above bioinformatics pipeline from data pre-processing through taxonomic assignment is available in the supplemental information in
The overall quality of the MiSeq reads was evaluated using FastQC (available from http://www.bioinformatics.babraham.ac.uk/projects/fastqc/) and the reads were assembled using the software FLASH with a minimum overlap of 10 bp (
The processed reads were subjected to local BLASTN searches against a custom-made database (
Determination of the number of eDNA copies by quantitative PCR
The copy numbers of total fish eDNA were quantified using the SYBR-GREEN qPCR method using a StepOne-Plus™ Real-Time PCR system (Applied Biosystems, Foster City, CA, USA). SYBR-GREEN qPCR was conducted in a 10-µL volume with a reaction solution that consisted of 5 µl of PowerUpTM SYBR® GREEN Master Mix (Thermo Fisher Scientific, Wilmington, DE, USA), 0.6 µl of 5 µM MiFish-U-F/R primers (without adaptor), 10 µl of sterilised H2O and 1.0 µl of DNA template. SYBR-GREEN qPCR was performed in triplicate for each eDNA sample, the standard dilution series and PCR negative controls. The standard dilution series was prepared using DNA extracted from Capoeta capoeta (Guldenstadt, 1773) (a freshwater fish species in Southeast Asia). C. capoetaas was selected as the standard because the length of the MiFish region of this species is close to the average length in fish species (C. capoeta = 174 bp, the average length of the MiFish region = 173 bp). The thermal cycle profile after preconditioning for 2 min at 50˚C and 2 min at 95˚C was as follows (40 cycles): denaturation at 95˚C for 3 s; annealing and extension combined at 60˚C (shuttle PCR) for 30 s. Although MiFish primers predominantly amplify fish (e)DNA, it should be noted that the quantification by SYBR-GREEN qPCR may include non-fish eDNA because non-target sequences (e.g. sequences longer than the MiFish region) are sometimes amplified when using MiFish primers and because SYBR-GREEN qPCR does not distinguish between fish and non-fish eDNA. However, if the ratio of non-fish and fish amplicons does not drastically differ amongst samples, the SYBR-GREEN qPCR should reflect the dynamics (i.e. temporal fluctuation pattern) of total fish eDNA reasonably well. In all experiments, PCR negative controls showed no detectable amplification.
In addition, fish-species-specific eDNA was quantified by real-time TaqMan® PCR according to using a StepOne-Plus™ Real-Time PCR system. The cytochrome b region of mitochondrial DNA was targeted for amplification from eDNA samples for each target species by using the following primer sets and associated probes, which were designed and confirmed as being able to amplify each target species specifically (
Statistical analysis
For all analyses, the free statistical environment R was used (
- the relationship between sequence reads and the copy numbers of the standard DNA for each sample,
- the conversion of sequence reads of non-standard fish eDNA to calculated copy numbers using the result of the linear regression for each sample and
- the comparison of eDNA copy numbers quantified by MiSeq and qPCR.
Linear regressions were performed using the lm function in R and used to examine how many sequence reads were generated from one (e)DNA copy through the library preparation process for MiSeq. Note that a linear regression between sequence reads and standard DNAs was performed for each sample and the intercept was set as zero. The regression equation was: MiSeq sequence reads = regression slope × the number of standard DNA copies [/µl]. The number of linear regressions performed was 52 (= the number of eDNA samples) and thus 52 regression slopes were estimated in total (see Suppl. material
The sequence reads of non-standard fish eDNAs were converted to calculated copy numbers using a sample-specific regression slope estimated by the first analysis. The number of non-standard eDNA copies was estimated by dividing MiSeq sequence reads by a sample-specific regression slope (i.e. the number of DNA copies = MiSeq sequence reads/regression slope; hereafter, this equation is referred to as ‘correction equation’). The estimated numbers of non-standard fish eDNA copies are hereafter referred to as ‘calculated copy numbers’ and this method itself (i.e. from an inclusion of standard DNA to the conversion of sequence reads using a correction equation) is hereafter referred to as ‘qMiSeq’.
Calculated copy numbers by qMiSeq were compared with copy numbers estimated by qPCR (see above sections for detailed qPCR method) by using four approaches. First, raw values (non-standardised copy numbers) were compared using linear regressions (i.e. first approach). As there were significant outliers, linear regressions were again performed by excluding the outliers (i.e. second approach). In addition, because the distribution of calculated copy numbers was highly right-skewed (i.e. many samples with low copy numbers and few samples with high copy numbers), log-transformation (base = 2) was applied after adding 0.5 to the raw values. The log-transformed values were further compared using linear regressions (i.e. third approach). Lastly, a Bland-Altman plot (difference plot) (
Data and code availability
Sequences are deposited in DDBJ Sequence Read Archive (DRA): Accession numbers are: DRA005598 (Submission ID), PRJDB5570 (BioProject ID) and SAMD00075651–SAMD00075720 (BioSample ID). All R codes and original data table used for the analyses are available at https://doi.org/10.5281/zenodo.1173828.
Results and discussion
Relationship between the copy numbers and sequence reads of the standard DNA
The sequence reads of the internal standard DNAs were significantly positively correlated with the copy numbers of those DNAs (Fig.
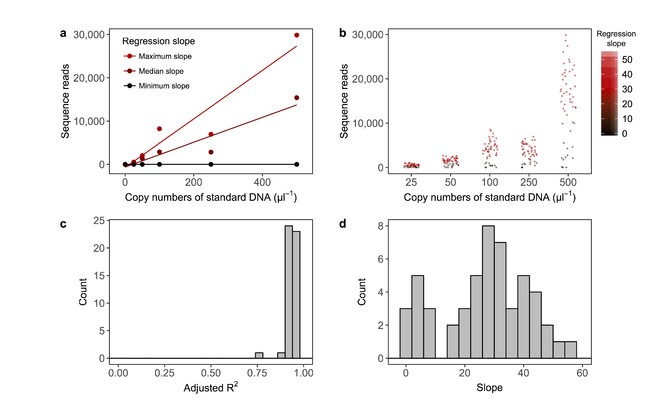
Summary of regression lines constructed using the number of copies added and sequence reads of internal standard DNAs. Examples of a regression line (a). Regression lines with the maximum, median and minimum slopes are indicated as examples of the relationships. The line indicates the regression line between the copy numbers of standard DNA (copies/µl) and sequence reads. The intercept of the regression line was set as zero. Distributions of sequence reads of internal standard DNAs (b). The intensity of red colour indicates the slope of regression line. Distribution of adjusted R2 of the regression lines (c). Note that a regression line was drawn for each eDNA sample and that the number of standard curves is equal to the number of eDNA samples (N = 52). Distribution of slopes of regression lines (d).
Quantification of the copy number using sequence reads and correction equations and comparison of the calculated copy number with the copy number quantified by qPCR
MiSeq sequence reads of each sample were converted using each correction equation (i.e. the number of eDNA copies [copies/µl] = MiSeq sequence reads / a sample-specific regression slope; the copy numbers and this method itself are referred to as ‘calculated DNA copies [copies/µl]’ and ‘qMiSeq’, respectively). Then, calculated DNA copies were compared with the number of DNA copies quantified by qPCR (Fig.
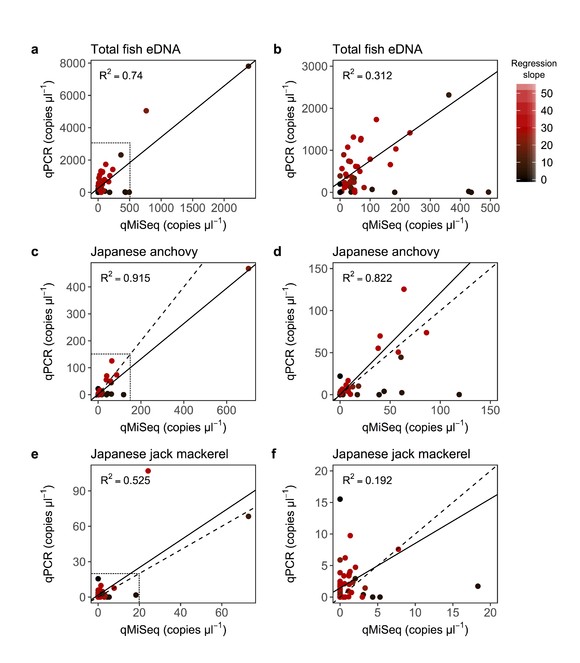
Relationship between the number of eDNA copies quantified by qPCR and that by qMiSeq. Correlations for the total fish eDNA (all data, a; enlarged figure, b), Japanese anchovy (Engraulis japonicus; all data, c; enlarged figure, d) and Japanese jack mackerel (Trachurus japonicus; all data, e; enlarged figure, f). Dashed and solid lines indicate 1:1 line and linear regression line, respectively. Regression lines in the enlarged figures were drawn by excluding outliers. All regression lines were significant (P < 0.05). Dotted boxed regions in a, c and e correspond to the range of the graphs in b, d and f, respectively. The intensity of red colour indicates the slope of the regression line (=correction equation) used to convert sequence reads to the calculated copy numbers.
Although the calculated DNA copies generally corresponded well with the eDNA copy numbers estimated by qPCR, the calculated DNA copies of some samples were much higher than the copy numbers obtained by qPCR (i.e. for the points close to the x-axis in Fig.
Some samples showed much lower eDNA copy numbers of Japanese jack mackerel when quantified by qMiSeq than when quantified by qPCR (i.e. points close to the y-axis; Fig.
Although the above analyses suggested that there is good agreement between the two methods, the distributions of calculated copy numbers as well as copy numbers estimated by qPCR were right-skewed (i.e. many low copy numbers and few high copy numbers) and thus the copy numbers were further compared after log-transformation of the raw values. Samples with regression slopes lower than 10 were excluded from this analysis because they suggested that there had been significant PCR inhibition during the qPCR measurements, as discussed above. It was found that there were positive and significant linear relationships between the copy numbers quantified by qMiSeq and qPCR even after the log-transformation (P < 0.05; Fig.
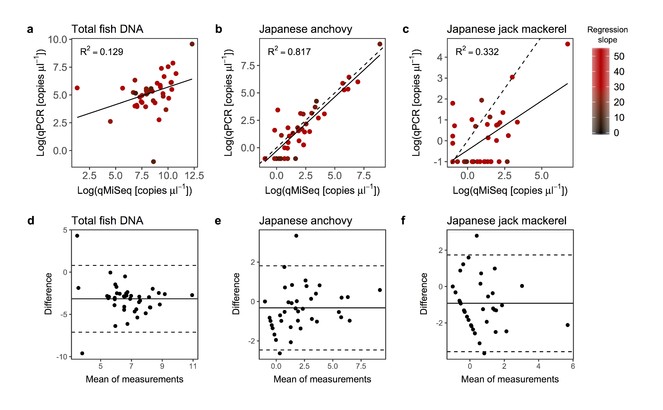
Relationships between log-transformed copy numbers quantified by qPCR and qMiSeq for the total fish eDNA (a), Japanese anchovy (Engraulis japonicus; b) and Japanese jack mackerel (Trachurus japonicus; c). A solid line is a linear regression line (all lines are significant; P < 0.05). The intensity of red colour indicates the slope of the regression line (i.e. correction equation) used to convert sequence reads to the copy numbers. Bland-Altman plot for log-transformed copy numbers of the total fish eDNA (d), Japanese anchovy (e) and Japanese jack mackerel (f). Dashed lines indicate 95% upper and lower limits and solid line indicates mean values. Note that, although it is not significant, the Bland-Altman plot for the log-transformed copy numbers of the total fish eDNA (d) showed that the calculated copy numbers by qMiSeq tends to be smaller than those by qPCR probably because of the removal of non-target amplified fragments before MiSeq sequencing (see discussion in the main text).
Temporal dynamics of Maizuru-bay fish eDNA revealed by qMiSeq
The temporal dynamics of the fish eDNA quantified by qMiSeq generally corresponded well with those quantified by qPCR (Fig.
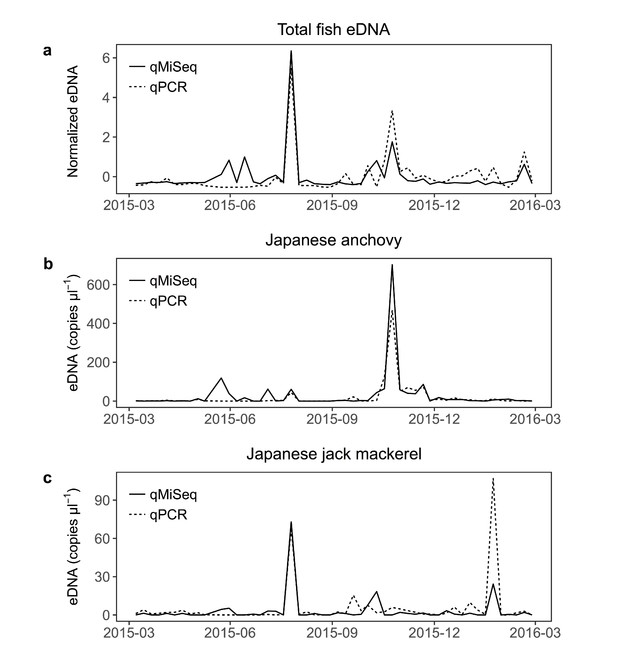
Dynamics of the total fish eDNA (a), Japanese anchovy (Engraulis japonicus; b) and Japanese jack mackerel (Trachurus japonicus; c) quantified by qMiSeq and qPCR. Solid and dashed lines indicate the number of eDNA copies quantified by qMiSeq and qPCR, respectively. Note that the copy numbers of total fish eDNA were normalised to have zero mean and unit variance.
The results obtained in the present study suggest that qMiSeq can reasonably recover the dynamics of fish eDNA. As eDNA metabarcoding can detect many species (sometimes more than 100 species) in a single run (
Quantitative and multispecies fish eDNA monitoring
This method enables the generation of a quantitative time series of eDNA for these fish species by a single MiSeq run and, as an example, an eDNA time series of the 10 most abundant fish species in terms of eDNA concentration is shown in Fig.
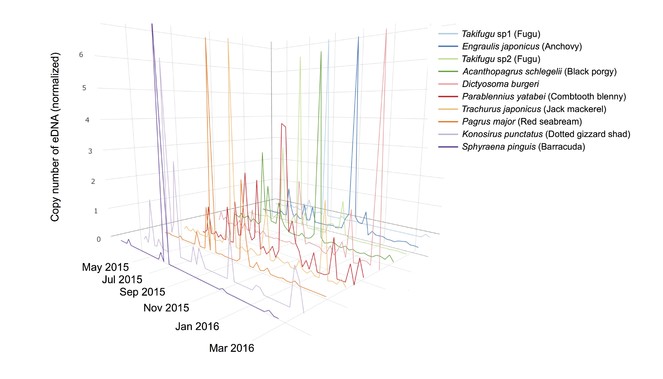
Quantitative and multispecies fish eDNA time series in Maizuru Bay, Japan. Time series of eDNA of 10 dominant fish species. In the eDNA analysis, two Takifugu species were detected as dominant species and were designated Takifugu sp1 and sp2. A representative sequence of Takifugu sp1 is highly similar to that of T. niphobles/T. snyderi (>99% identity). A representative sequence of Takifugu sp2 is identical with that of T. pardadalis/T. xanthopterus/T. poecilonotus (100% identity). Different colours indicate different fish species. The numbers of eDNA copies were normalised to have zero mean and unit variance.
As eDNA metabarcoding has been recognised as an efficient approach in species detection and biodiversity assessment (
The quantities of internal standards are precisely known and thus the use of an internal standard would enable rigorous and quantitative comparisons even between different experiments/studies (given the same PCR primers are used), which would facilitate the use of eDNA metabarcoding as a tool for biodiversity monitoring. Furthermore, this method, i.e. the addition of purified DNA fragments, would be less time- and effort-consuming than the use of tissues of standard organisms as internal standards (
Conclusions
In the present study, it was shown that eDNA metabarcoding, performed with the inclusion of internal standard DNA, enables simultaneous determination of the quantity and identity of eDNA derived from multiple fish species. As the traditional species-specific qPCR allows quantification of eDNA from only one fish species in a single experiment, this method is much more efficient compared with qPCR. In addition, this method can take effects of PCR inhibition into account. Although it should be mentioned that fish eDNA copy numbers are still only a rough index of fish biomass/abundance (or population size) and this problem should be addressed in a future study (e.g. estimating taxon-specific correction factors is a promising direction; see
Acknowledgements
We would like to thank Aina Tanimoto for help with the collection and filtration of water samples and Hideyuki Doi for providing meaningful comments on the manuscript. We also thank The Research Center for Satoyama Studies at Ryukoku University for providing an opportunity to use the Illumina MiSeq platform.
Funding program
This research was supported by CREST (JMPJCR13A2) from the Japan Science and Technology Agency (JST).
Ethics and security
The experiments were conducted in accordance with the guidelines of Regulation of Animal Experimentation at Kyoto University. Water sampling permission in or around the pier was not needed.
Author contributions
MU conceived and designed research; HM and RM performed sampling; MU, HM, RM, TS, MM, SS, HY and TM performed experiments; MU analysed data; MU wrote the early draft and completed it with significant inputs from all authors.
Conflicts of interest
The authors declare no competing interests.
References
- The ecology of environmental DNA and implications for conservation genetics.Conservation Genetics17(1):1‑17. https://doi.org/10.1007/s10592-015-0775-4
- In situ detection of freshwater fungi in an alpine stream by new taxon-specific fluorescence in situ hybridization probes.Applied and Environmental Microbiology74(20):6427‑6436. https://doi.org/10.1128/aem.00815-08
- Annual time-series analysis of aqueous eDNA reveals ecologically relevant dynamics of lake ecosystem biodiversity.Nature Communications8:14087. https://doi.org/10.1038/ncomms14087
- Statistical methods for assessing agreement between two methods of clinical measurement.Lancet (London, England)1(8476):307‑10. https://doi.org/10.1016/S0140-6736(86)90837-8
- BLAST+: architecture and applications.BMC Bioinformatics10(1):421. https://doi.org/10.1186/1471-2105-10-421
- Development and validation of environmental DNA (eDNA) markers for detection of freshwater turtles.PLOS ONE10(7):e0130965. https://doi.org/10.1371/journal.pone.0130965
- Environmental DNA reveals that rivers are conveyer belts of biodiversity information.Nature Communications7:12544. https://doi.org/10.1038/ncomms12544
- Persistence of environmental DNA in freshwater ecosystems.PLoS ONE6(8):e23398. https://doi.org/10.1371/journal.pone.0023398
- Search and clustering orders of magnitude faster than BLAST.Bioinformatics26(19):2460‑2461. https://doi.org/10.1093/bioinformatics/btq461
- Can DNA-based ecosystem assessments quantify species abundance? Testing primer bias and biomass—sequence relationships with an innovative metabarcoding protocol.PLOS ONE10(7):e0130324. https://doi.org/10.1371/journal.pone.0130324
- Quantification of mesocosm fish and amphibian species diversity via environmental DNA metabarcoding.Molecular Ecology Resources16(1):29‑41. https://doi.org/10.1111/1755-0998.12433
- Species detection using environmental DNA from water samples.Biology Letters4(4):423‑425. https://doi.org/10.1098/rsbl.2008.0118
- A basin-scale application of environmental DNA assessment for rare endemic species and closely related exotic species in rivers: a case study of giant salamanders in Japan.Journal of Applied Ecology52(2):358‑365. https://doi.org/10.1111/1365-2664.12392
- Environmental DNA metabarcoding of lake fish communities reflects long-term data from established survey methods.Molecular Ecology25(13):3101‑3119. https://doi.org/10.1111/mec.13660
- Development of a novel internal positive control for Taqman® based assays.Molecular and Cellular Probes19(1):51‑59. https://doi.org/10.1016/j.mcp.2004.07.006
- MitoFish and MitoAnnotator: A mitochondrial genome database of fish with an accurate and automatic annotation pipeline.Molecular Biology and Evolution30(11):2531‑2540. https://doi.org/10.1093/molbev/mst141
- “Sight-unseen” detection of rare aquatic species using environmental DNA.Conservation Letters4(2):150‑157. https://doi.org/10.1111/j.1755-263x.2010.00158.x
- Using environmental DNA to census marine fishes in a large mesocosm.PLoS ONE9(1):e86175. https://doi.org/10.1371/journal.pone.0086175
- Harnessing DNA to improve environmental management.Science344(6191):1455‑1456. https://doi.org/10.1126/science.1251156
- At the forefront: evidence of the applicability of using environmental DNA to quantify the abundance of fish populations in natural lentic waters with additional sampling considerations.Canadian Journal of Fisheries and Aquatic Sciences74(12):2030‑2034. https://doi.org/10.1139/cjfas-2017-0114
- Estimating and mitigating amplification bias in qualitative and quantitative arthropod metabarcoding.Scientific Reports7(1). https://doi.org/10.1038/s41598-017-17333-x
- BlandAltmanLeh: Plots (Slightly Extended) Bland-Altman Plots.R package version 0.3.1URL: https://CRAN.R-project.org/package=BlandAltmanLeh
- FLASH: fast length adjustment of short reads to improve genome assemblies.Bioinformatics27(21):2957‑2963. https://doi.org/10.1093/bioinformatics/btr507
- The release rate of environmental DNA from juvenile and adult fish.PLoS ONE9(12):e114639. https://doi.org/10.1371/journal.pone.0114639
- Seasonal and interannual variation of subtidal fish assemblages in Wakasa Bay with reference to the warming trend in the Sea of Japan.Environmental Biology of Fishes82(4):387‑399. https://doi.org/10.1007/s10641-007-9300-z
- Fish assemblages associated with three types of artificial reefs: density of assemblages and possible impacts on adjacent fish abundance.Fishery Bulletin108(2):162‑173.
- Surveillance of fish species composition using environmental DNA.Limnology13(2):193‑197. https://doi.org/10.1007/s10201-011-0362-4
- MiFish, a set of universal PCR primers for metabarcoding environmental DNA from fishes: detection of more than 230 subtropical marine species.Royal Society Open Science2(7):150088. https://doi.org/10.1098/rsos.150088
- R: A language and environment for statistical computing.3.3.0. URL: https://www.r-project.org/
- Camera-trapping rates of mammals and birds in a Bornean tropical rainforest under sustainable forest management.Forest Ecology and Management270:248‑256. https://doi.org/10.1016/j.foreco.2012.01.013
- PCR inhibitors - occurrence, properties and removal.Journal of Applied Microbiology113(5):1014‑1026. https://doi.org/10.1111/j.1365-2672.2012.05384.x
- Monitoring the near-extinct European weather loach in Denmark based on environmental DNA from water samples.Biological Conservation183:46‑52. https://doi.org/10.1016/j.biocon.2014.11.023
- Active and passive environmental DNA surveillance of aquatic invasive species.Canadian Journal of Fisheries and Aquatic Sciences73(1):76‑83. https://doi.org/10.1139/cjfas-2015-0262
- A method for simultaneous measurement of soil bacterial abundances and community composition via 16S rRNA gene sequencing.Soil Biology and Biochemistry96:145‑151. https://doi.org/10.1016/j.soilbio.2016.02.003
- Aquatic environmental DNA detects seasonal fish abundance and habitat preference in an urban estuary.PLOS ONE12(4):e0175186. https://doi.org/10.1371/journal.pone.0175186
- Towards next-generation biodiversity assessment using DNA metabarcoding.Molecular Ecology21(8):2045‑2050. https://doi.org/10.1111/j.1365-294x.2012.05470.x
- Estimation of fish biomass using environmental DNA.PLoS ONE7(4):e35868. https://doi.org/10.1371/journal.pone.0035868
- Using environmental DNA to estimate the distribution of an invasive fish species in ponds.PLoS ONE8(2):e56584. https://doi.org/10.1371/journal.pone.0056584
- Quantitative DNA metabarcoding: improved estimates of species proportional biomass using correction factors derived from control material.Molecular Ecology Resources16(3):714‑726. https://doi.org/10.1111/1755-0998.12490
- Monitoring endangered freshwater biodiversity using environmental DNA.Molecular Ecology21(11):2565‑2573. https://doi.org/10.1111/j.1365-294x.2011.05418.x
- Water temperature-dependent degradation of environmental DNA and its relation to bacterial abundance.PLOS ONE12(4):e0176608. https://doi.org/10.1371/journal.pone.0176608
- Fish environmental DNA is more concentrated in aquatic sediments than surface water.Biological Conservation183:93‑102. https://doi.org/10.1016/j.biocon.2014.11.017
- Demonstration of the potential of environmental DNA as a tool for the detection of avian species.bioRxihttps://doi.org/10.1101/199208
- Environmental DNA enables detection of terrestrial mammals from forest pond water.Molecular Ecology Resources17(6):e63‑e75. https://doi.org/10.1111/1755-0998.12690
- Environmental DNA as a ‘Snapshot’ of fish distribution: A case study of Japanese jack mackerel in Maizuru Bay, Sea of Japan.PLOS ONE11(3):e0149786. https://doi.org/10.1371/journal.pone.0149786
- Environmental DNA metabarcoding reveals local fish communities in a species-rich coastal sea.Scientific Reports7:40368. https://doi.org/10.1038/srep40368
Supplementary materials
The relationship between MiSeq sequence reads and copy numbers of standard DNAs for 52 samples. Blue line indicates the linear regression between sequence reads and copy numbers. The regression lines are used to convert the MiSeq reads into the calculated copy numbers. Numbers in a grey region indicate sampling date. Note that regression slopes are different amongst samples, i.e. the number of sequence reads generated per eDNA copy is different amongst samples.
The relationship between regression residuals and copy numbers of standard DNAs for 52 samples. Dashed line indicates zero residuals.
The relationship between MiSeq sequence reads and DNA copy numbers quantified by qPCR. Correlations for the total fish eDNA (all data, a; enlarged figure, b), Japanese anchovy (Engraulis japonicus; all data, c; enlarged figure, d) and Japanese jack mackerel (Trachurus japonicus; all data, e; enlarged figure, f). Dashed and soild lines indicate 1:1 line and linear regression line, respectively. Regression lines in the enlarged figures were drawn by excluding outliers. All regression lines, except for the lines for total fish eDNA, were significant (P < 0.05). Dotted boxed regions in a, c and e correspond to the range of the graphs in b, d and f, respectively. The intensity of red colour indicates the slope of the regression line used to convert sequence reads to the copy numbers.
Bland-Altman plots for the total fish eDNA (a), Japanese anchovy (Engraulis japonicus; b) and Japanese jack mackerel (Trachurus japonicus; c). Dashed lines indicate 95% uppper and lower limits and solid line indicates mean value.