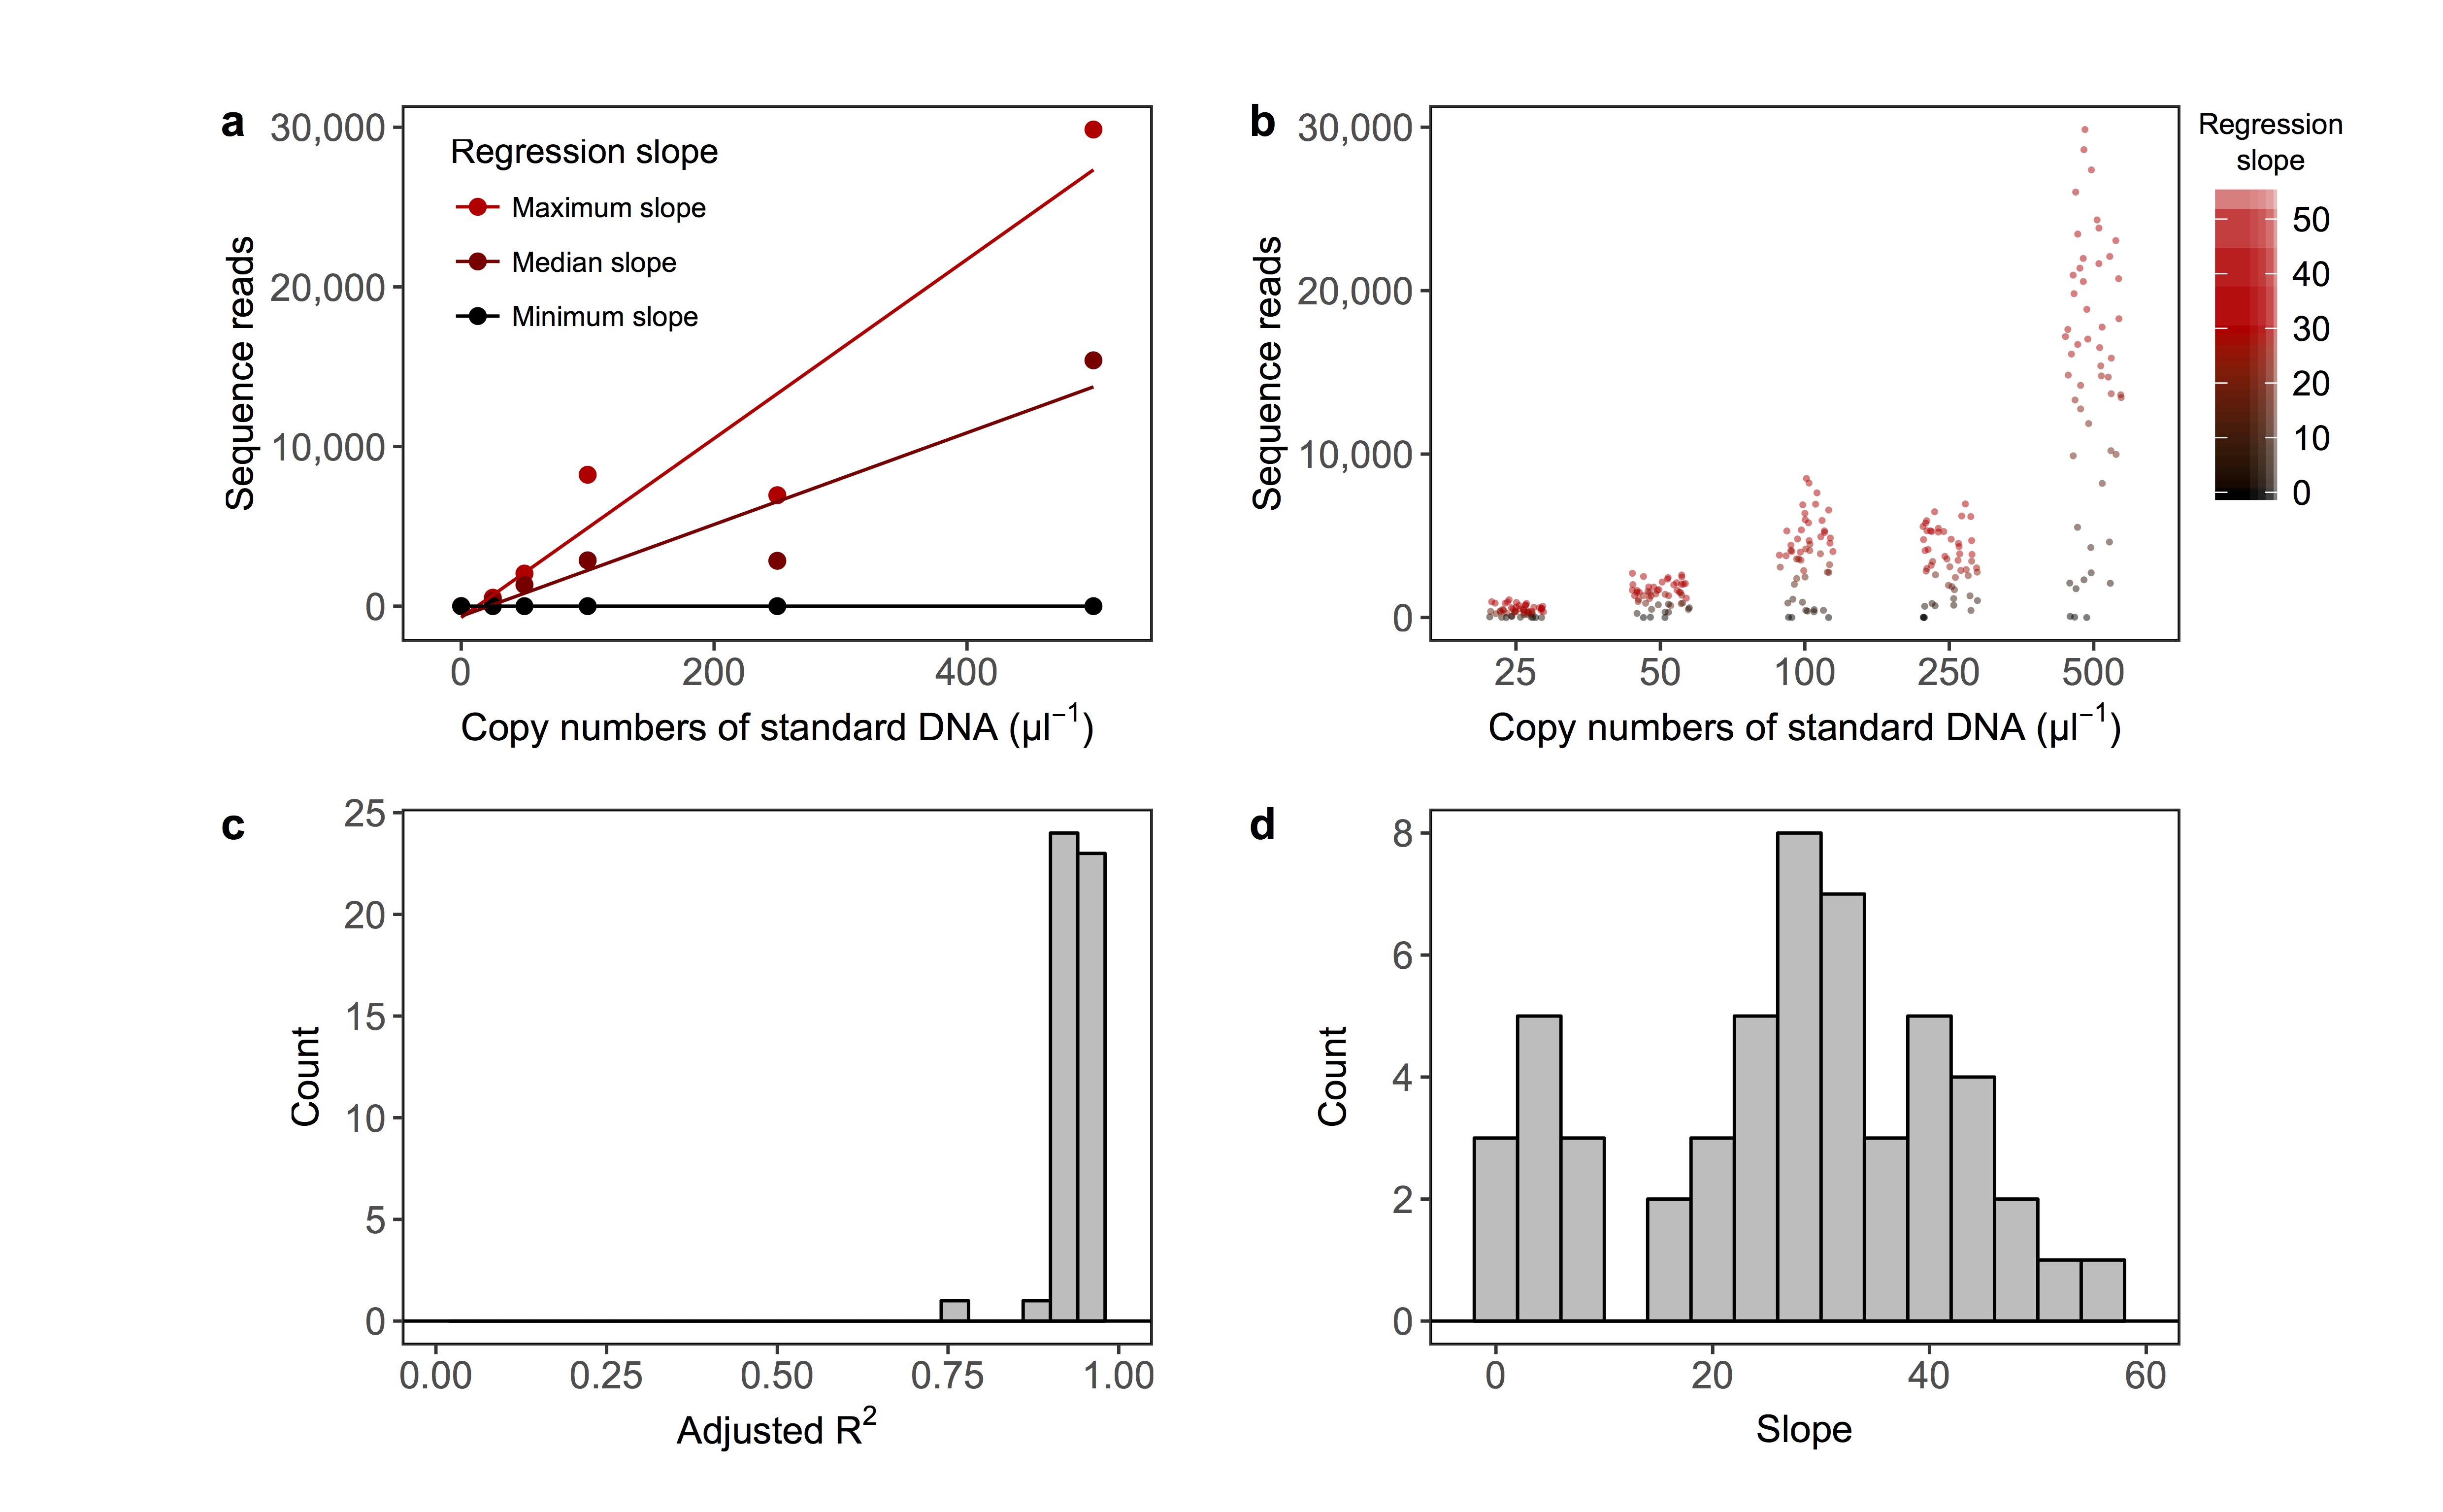
Summary of regression lines constructed using the number of copies added and sequence reads of internal standard DNAs. Examples of a regression line (a). Regression lines with the maximum, median and minimum slopes are indicated as examples of the relationships. The line indicates the regression line between the copy numbers of standard DNA (copies/µl) and sequence reads. The intercept of the regression line was set as zero. Distributions of sequence reads of internal standard DNAs (b). The intensity of red colour indicates the slope of regression line. Distribution of adjusted R2 of the regression lines (c). Note that a regression line was drawn for each eDNA sample and that the number of standard curves is equal to the number of eDNA samples (N = 52). Distribution of slopes of regression lines (d).