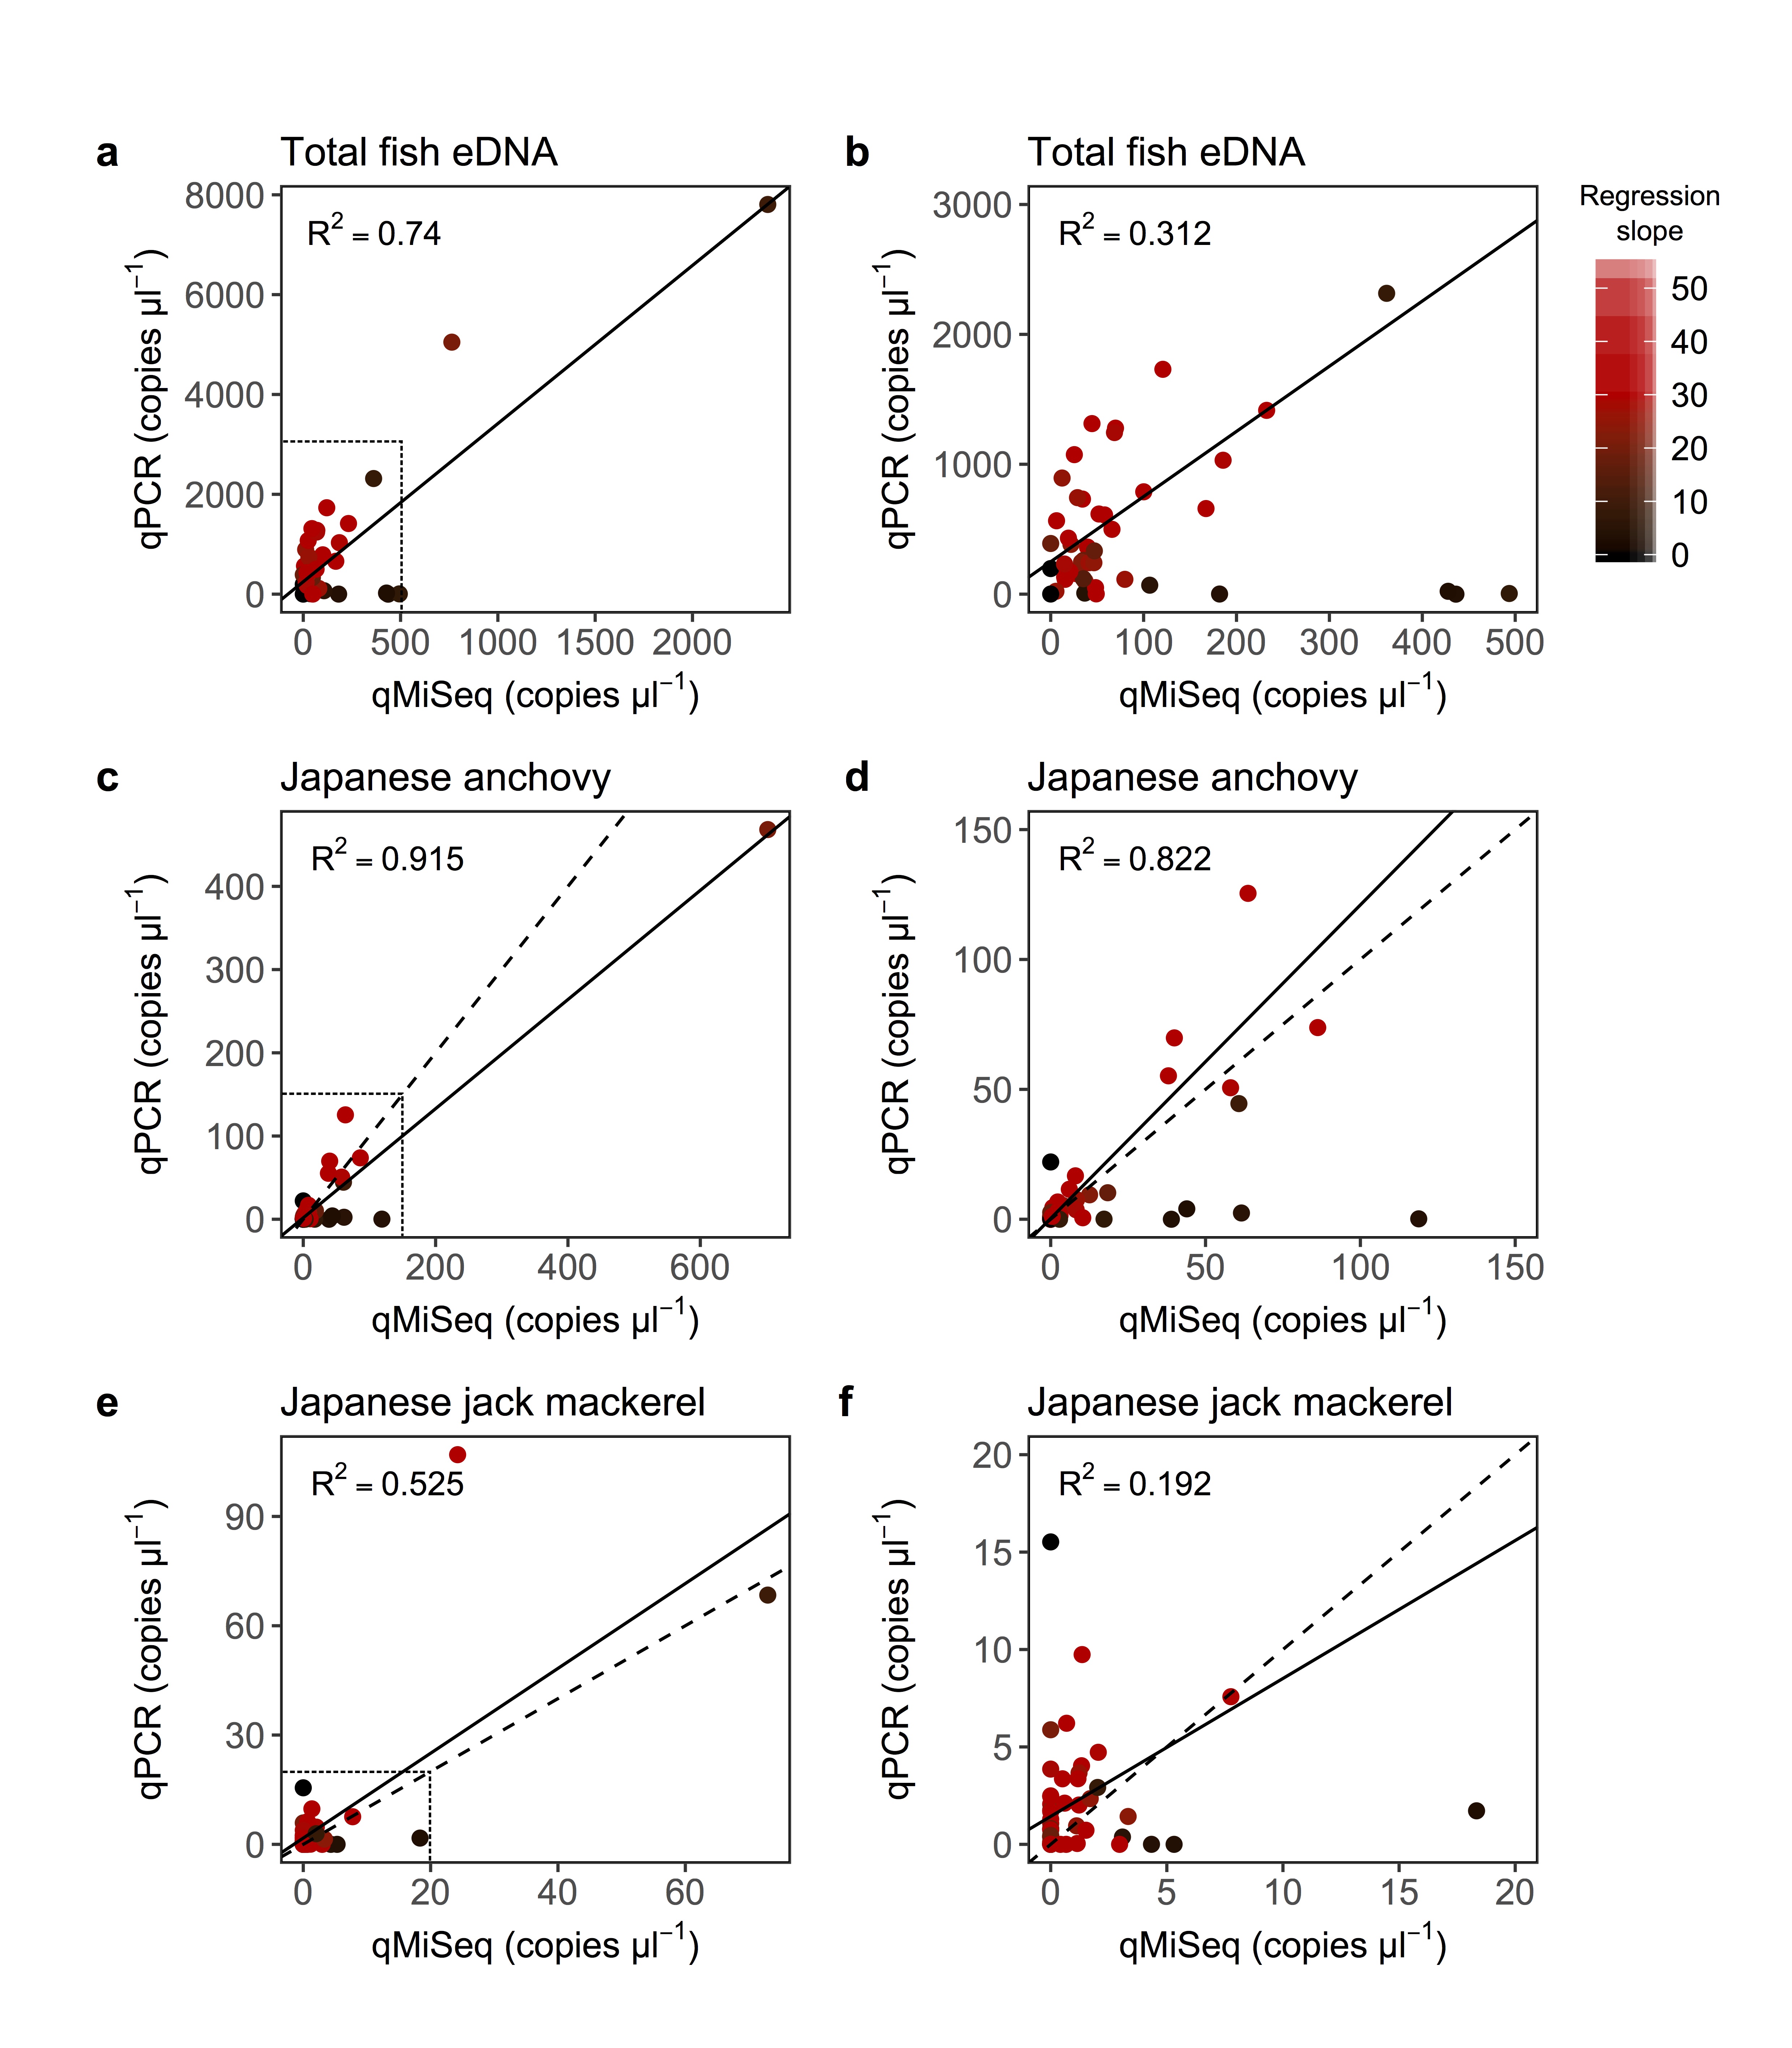
Relationship between the number of eDNA copies quantified by qPCR and that by qMiSeq. Correlations for the total fish eDNA (all data, a; enlarged figure, b), Japanese anchovy (Engraulis japonicus; all data, c; enlarged figure, d) and Japanese jack mackerel (Trachurus japonicus; all data, e; enlarged figure, f). Dashed and solid lines indicate 1:1 line and linear regression line, respectively. Regression lines in the enlarged figures were drawn by excluding outliers. All regression lines were significant (P < 0.05). Dotted boxed regions in a, c and e correspond to the range of the graphs in b, d and f, respectively. The intensity of red colour indicates the slope of the regression line (=correction equation) used to convert sequence reads to the calculated copy numbers.