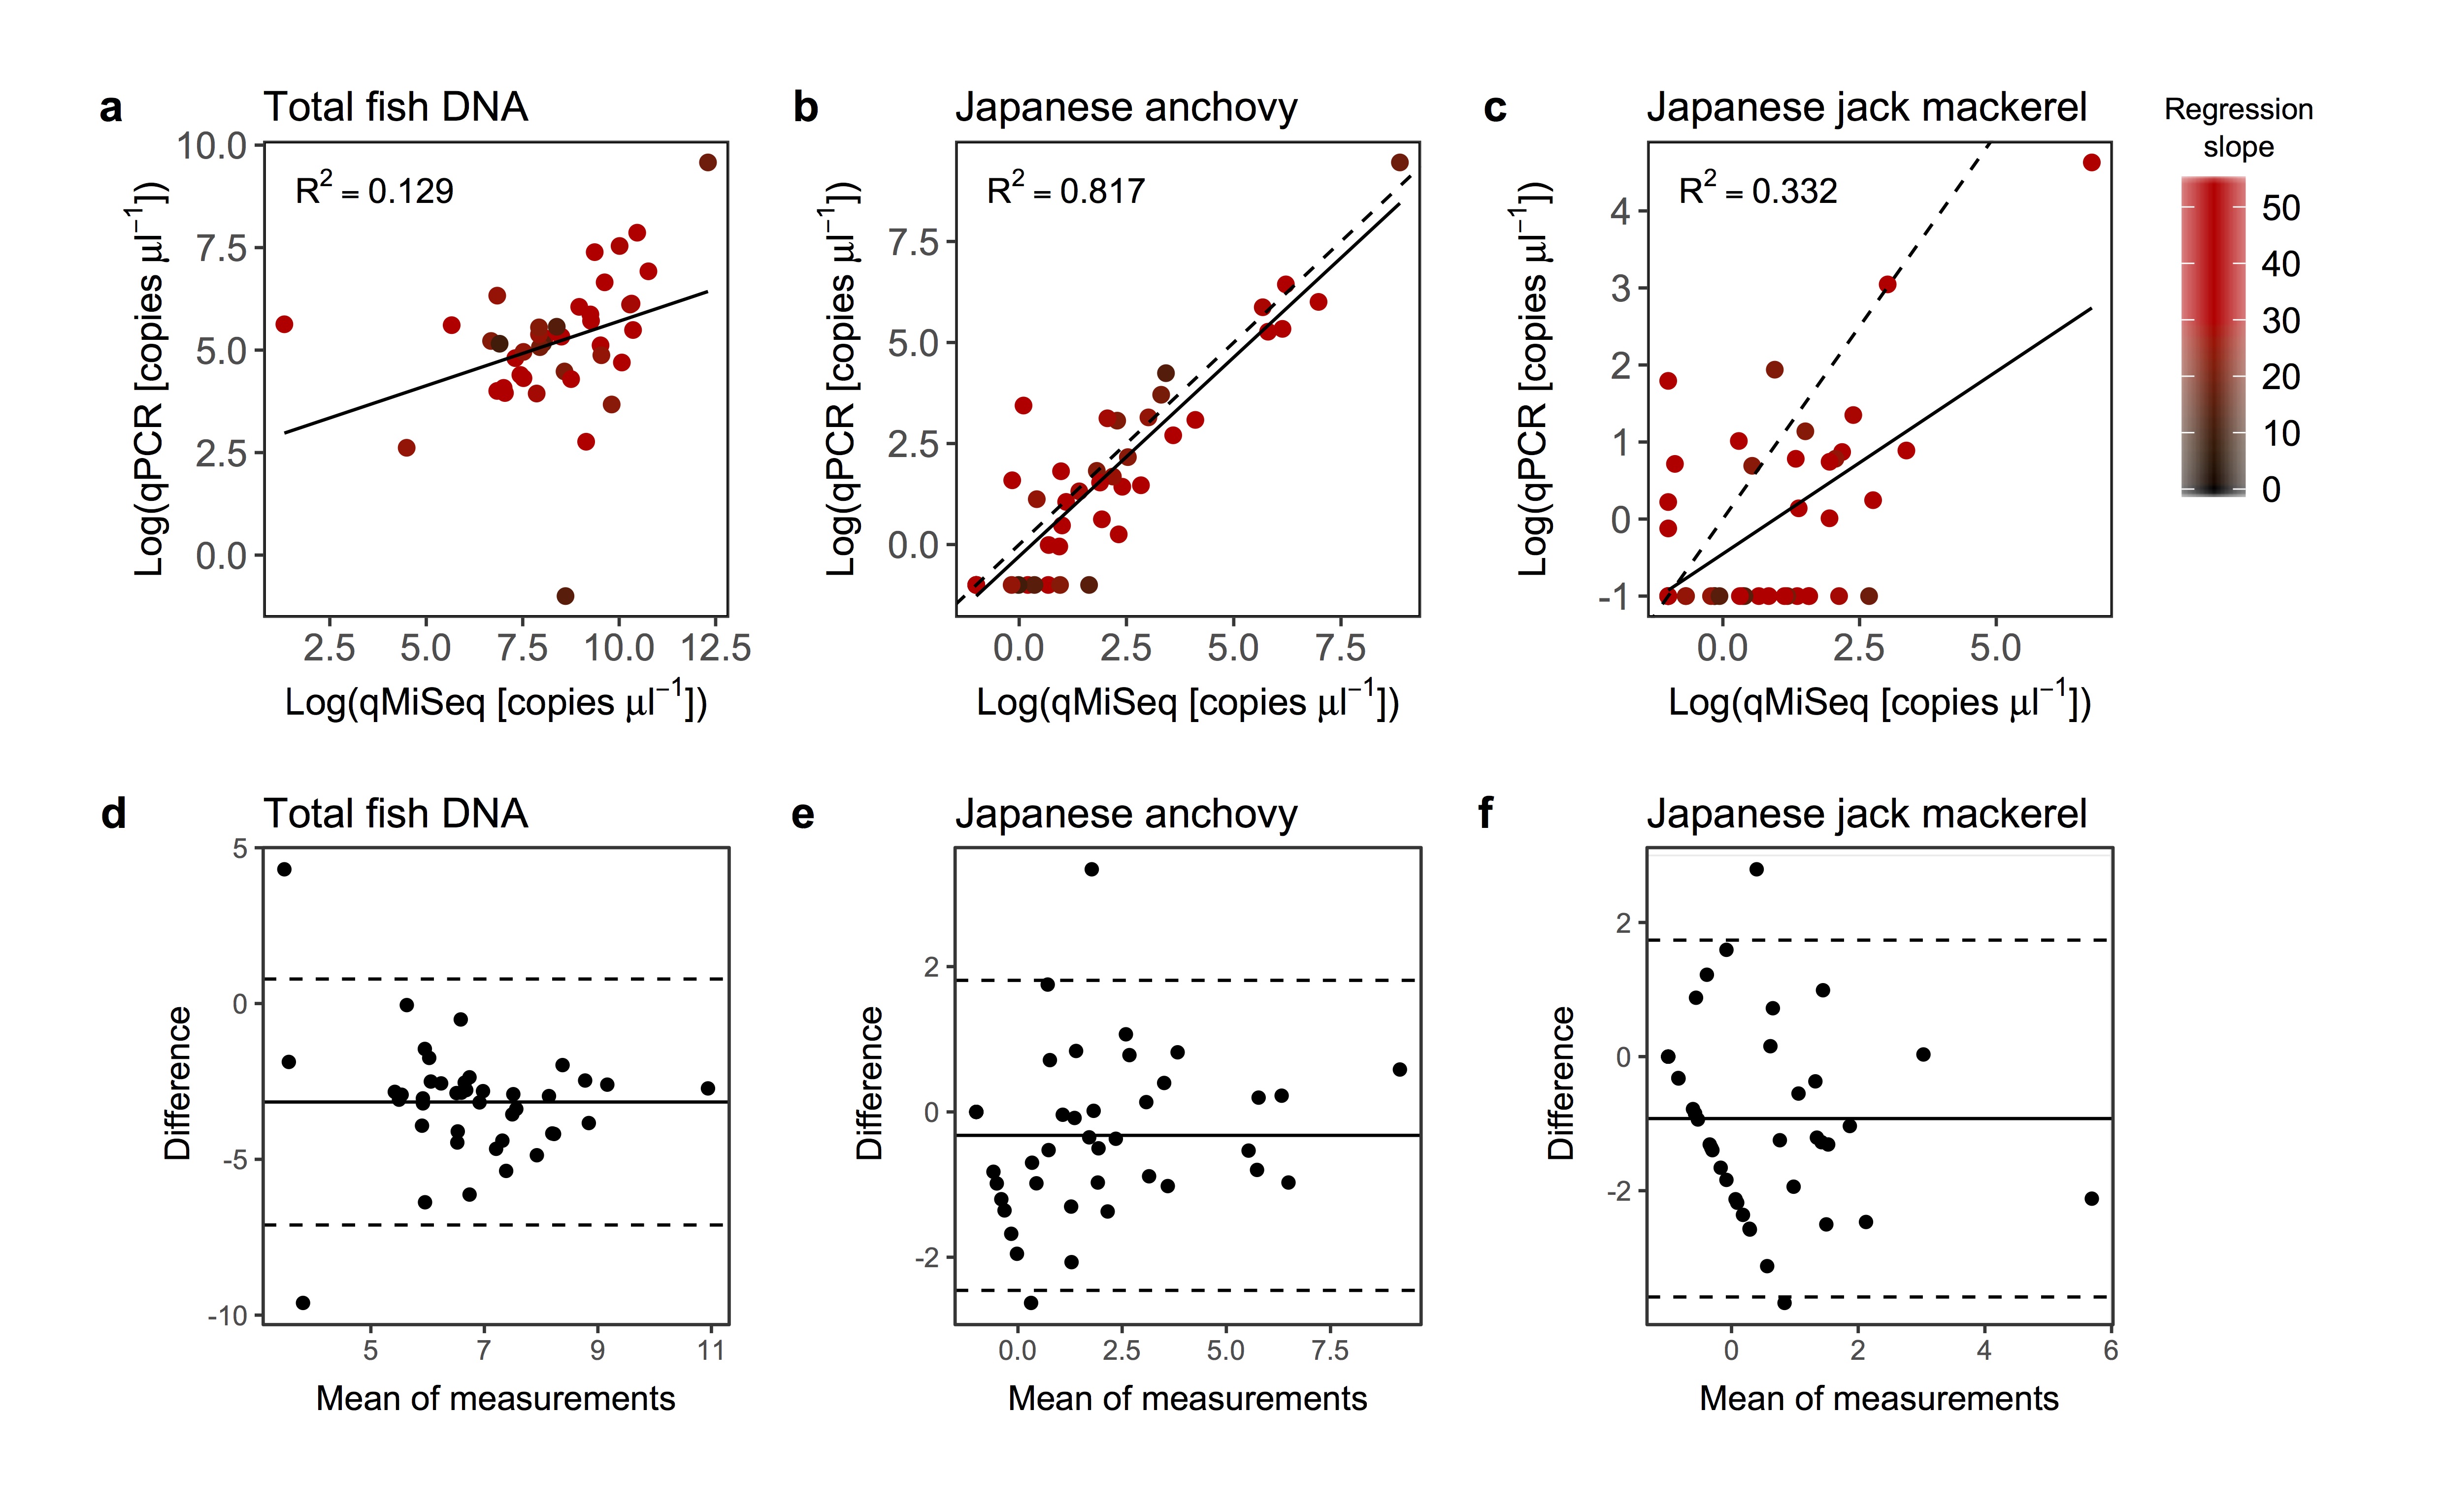
Relationships between log-transformed copy numbers quantified by qPCR and qMiSeq for the total fish eDNA (a), Japanese anchovy (Engraulis japonicus; b) and Japanese jack mackerel (Trachurus japonicus; c). A solid line is a linear regression line (all lines are significant; P < 0.05). The intensity of red colour indicates the slope of the regression line (i.e. correction equation) used to convert sequence reads to the copy numbers. Bland-Altman plot for log-transformed copy numbers of the total fish eDNA (d), Japanese anchovy (e) and Japanese jack mackerel (f). Dashed lines indicate 95% upper and lower limits and solid line indicates mean values. Note that, although it is not significant, the Bland-Altman plot for the log-transformed copy numbers of the total fish eDNA (d) showed that the calculated copy numbers by qMiSeq tends to be smaller than those by qPCR probably because of the removal of non-target amplified fragments before MiSeq sequencing (see discussion in the main text).