|
Metabarcoding and Metagenomics :
Primer Validation
|
|
Corresponding author: Ecaterina Edith Vamos (edith.vamos@uni-due.de), Vasco Elbrecht (V.Elbrecht@leibniz-zfmk.de)
Academic editor: Owen S. Wangensteen
Received: 21 Jun 2017 | Accepted: 10 Aug 2017 | Published: 20 Sep 2017
© 2017 Ecaterina Vamos, Vasco Elbrecht, Florian Leese
This is an open access article distributed under the terms of the Creative Commons Attribution License (CC BY 4.0), which permits unrestricted use, distribution, and reproduction in any medium, provided the original author and source are credited.
Citation:
Vamos E, Elbrecht V, Leese F (2017) Short COI markers for freshwater macroinvertebrate metabarcoding. Metabarcoding and Metagenomics 1: e14625. https://doi.org/10.3897/mbmg.1.14625
|
|
Abstract
Species diversity of metazoan bulk samples can be rapidly assessed using cytochrome c oxidase I (COI) metabarcoding. However, in some applications often only degraded DNA is available, e.g. from poorly conserved museum specimens, environmental DNA (eDNA) filtered from water or gut content analyses. Here universal primer sets targeting only a short COI fragment are advantageous, as they often can still amplify short DNA fragments. Using PrimerMiner, we optimised two universal primer sets targeting freshwater macroinvertebrates based on NCBI and BOLD reference sequences. The fwh1 and fwh2 primer sets targeting a 178 and 205 bp region were tested in vitro by sequencing previously used freshwater macroinvertebrate mock communities as well as three monitoring samples from Romanian streams of unknown composition. They were further evaluated in silico for their suitability to amplify other insect groups. The fwh1 primer sets showed the most consistent amplification in silico and in vitro, detecting 92% of the taxa present in the mock communities, and allowing clear differentiation between the three macroinvertebrate communities from the Romanian streams. In silico analysis indicates that the short primers are likely to perform well even for non-freshwater insects. Comparing the performance of the new fwh1 primer sets to a highly degenerate primer set targeting a longer fragment (BF2+BR2) revealed that detection efficiency is slightly lower for the new primer set. Nevertheless, the shorter new primer pairs might be useful for studies that have to rely on degraded or poorly conserved DNA and thus be of importance for biomonitoring, conservation biological or molecular ecological studies. Furthermore, our study highlights the need for in silico evaluation of primer sets in order to detect design errors in primers (fwhR2) and find optimal universal primer sets for the target taxa of interest.
Keywords
metabarcoding, COI primers, degraded DNA, biodiversity assessment, freshwater macroinvertebrates, in silico
Introduction
Understanding ecosystem diversity and associated processes is essential for the management and protection of the biosphere. However, it is often challenging and time-consuming to reliably detect and identify organisms present in environmental samples (
In this study, we developed short metabarcoding primer pairs optimised to amplify degraded DNA from freshwater macroinvertebrates. We used COI reference sequences for 15 major freshwater groups important for bioassessment (see
Material and Methods
Primer development
Two primer sets were developed using PrimerMiner (
|
Primer name |
Degenerated sequence (5’->3’) |
Direction |
Based on |
|
fwhF1 |
YTCHACWAAYCAYAARGAYATYGG |
Forward |
LCO1490 ( |
|
fwhR1 |
ARTCARTTWCCRAAHCCHCC |
Reverse |
ZBJ-ArtR2c ( |
|
fwhF2 |
GGDACWGGWTGAACWGTWTAYCCHCC |
Forward |
mlCOIintF ( |
|
fwhR2 |
GTRATWGCHCCDGCAARWACWGG |
Reverse |
ArR5 ( |
|
fwhR2n |
GTRATWGCHCCDGCTARWACWGG |
Reverse |
ArR5 ( |
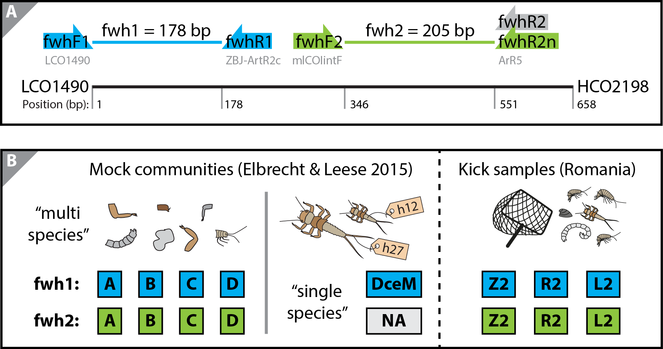
Developed primer sets and samples sequenced for primer validation. Two independent PCR replicates were run and sequenced for each sample. A: Binding sites of the two primer sets (fwhF1+fwhR1 and fwhF2+fwhR2) targeting a 178 and 205 bp fragment internal to the COI Folmer barcoding region (
In silico evaluation of primers
To explore the broader performance of the newly developed primers compared to the commonly used primers sets (Suppl. material
Sample collection and processing
The performance of the fwh1 and fwh2 primer sets was evaluated using four previously used mock communities each containing 52 different freshwater taxa (sample A, B, C and D) and one single species mock sample with 31 specimens with unique haplotypes and known biomass (
DNA extraction and tissue pooling
Specimens of each size category (S, M & L) were dried overnight in sterile Petri dishes to remove the ethanol. Specimens from each category were homogenised using an IKA ULTRA-TURRAX Tube Drive control system (IKA, Staufen, Germany) with sterile 20 mL tubes and 10 steel beads (5 mm Ø) by grinding at 4000 rpm for 30 minutes. Approximately equal amounts of grinded tissue from each category were digested following a modified salt DNA extraction protocol (on average 13.41 mg of tissue, SD = 12.34 mg,
DNA metabarcoding and bioinformatics
The five mock communities and three kick samples were amplified in duplicates in a one-step PCR using the developed freshwater primers (Table
Results
Primer design and in silico evaluation
Two primer sets were developed targeting short COI fragment lengths of 178 bp and 205 bp respectively (Fig.
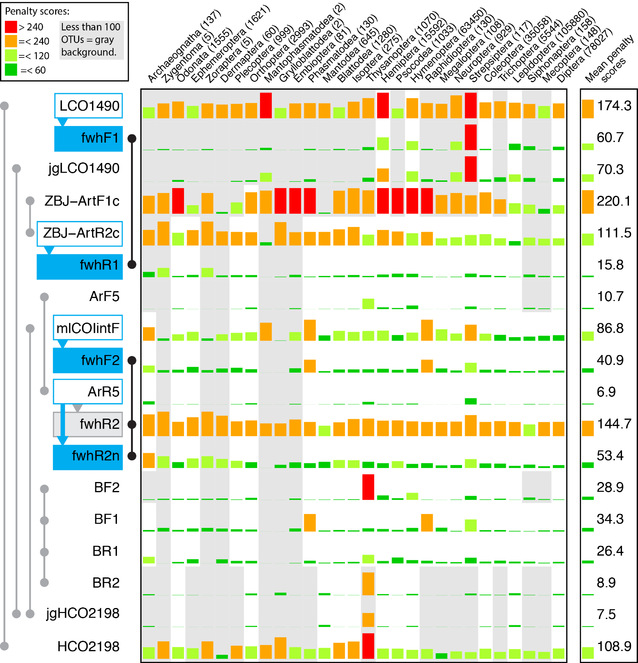
In silico evaluation of insect groups (after
The other evaluated primer sets showed mixed performances depending on the degeneracy of the respective primers. A lack of degeneracy resulted in rather high penalty scores, as was the case for the LCO1490+HCO2198 and ZBJ-ArtF1c+ZBJ-ArtR2c primer sets (scores above 100,
Metabarcoding and Illumina sequencing
Both fwh primer sets successfully amplified the four multispecies mock communities (A, B, C and D) as well as the three Romanian stream kick samples. The fwh2 primers only produced a weak amplicon band on the agarose gel for the DceM sample, which was therefore only sequenced using the fwh1 primer set. Both Illumina MiSeq runs were successful for all sequenced samples with an average number of 1.40 (fwh1) and 0.74 (fwh2) million sequences obtained for each replicate (SD = 0.26 and 0.13, Suppl. material
Taxa recovery in mock and bulk samples
For the four mock communities, most of the taxa were recovered by both primer sets. While fwh1 primers detected 48 taxa out of 52, the fwh2 performed poorer, recovering 46 taxa (Fig.
Number of morphotaxa recovered with the fwh and Folmer primers from previous tests (
|
Taxonomic group |
No. of specimens |
No. of specimens recovered with specific primer combination |
||
|
LCO1490+HCO2198 |
fwhF1+fwhR1 |
fwhF2+fwhR2 |
||
|
Ephemeroptera |
8 |
7 (88%) |
8 (100%) |
7 (88%) |
|
Plecoptera |
4 |
4 (100%) |
4 (100%) |
4 (100%) |
|
Trichoptera |
15 |
13 (86%) |
14 (93%) |
15 (100%) |
|
Diptera |
8 |
7 (88%) |
8 (100%) |
8 (100%) |
|
Other insects |
7 |
7 (100%) |
7 (100%) |
7 (100%) |
|
Other metazoan |
10 |
5 (50%) |
7 (70%) |
5 (50%) |
|
Ʃ All insects |
42 |
38 (91%) |
41 (98%) |
41 (98%) |
|
SD * |
1.01 |
0.62 |
0.97 |
|
|
Precision ** |
0.72 |
0.43 |
0.68 |
|
|
Ʃ All taxa |
52 |
43 (83%) |
48 (92%) |
46 (88%) |
* Mean standard deviation (SD) of log10 read abundance from each insect taxon that was detected (specimens with < 0.003% read abundance discarded). **Precision defined as the SD of the mean log10 distance to the expected read abundance, calculated for each morphotaxon (all taxa).
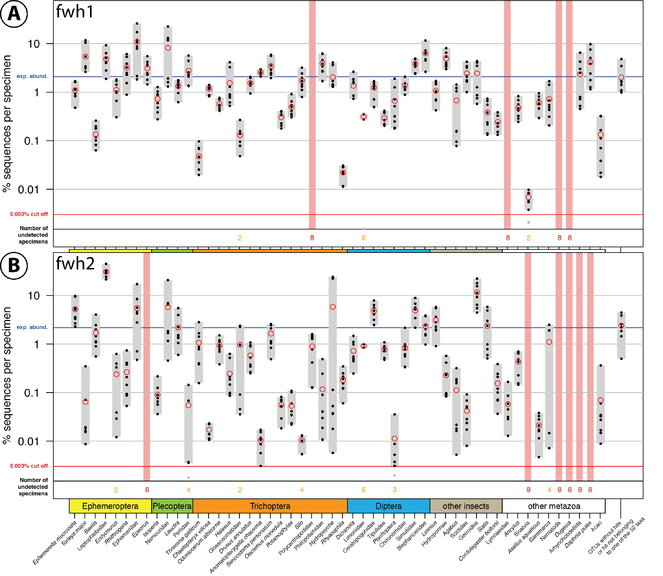
Comparison of fwh1 (A) and fwh2 (B) primer performance, both tested with the same four bulk samples with two independent PCR replicates for each sample. Each respective sample contained 52 morphologically distinct macroinvertebrate taxa ("TierMix": A, B, C & D). The 52 taxa are shown on the x-axis with the number of reads obtained for each morphotaxon indicated by black dots on the logarithmic y-axis (mean relative abundance of detected morphotaxa is indicated by red circles, replicates are plotted). Sequence abundance was normalised across the samples and the amount of tissue used in each DNA extraction. Only OTUs which had a minimum abundance of 0.003% in at least one of the four samples were included in the analysis. Number of samples for which a morphotaxon was not detected is indicated by orange and red numbers in each plot. A thick vertical line in light red indicates if a morphotaxon was not detected.
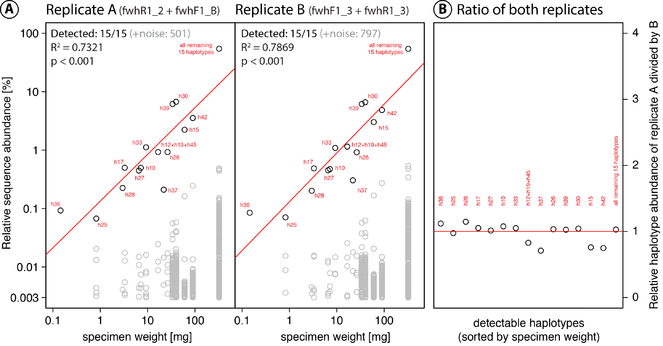
Detection of haplotypes in the tested single species mock community (DceM) using the fwh1 primer set. Sequences below 0.003% relative read abundance were discarded. A: Relative abundance of detected haplotypes in both PCR replicates plotted against cumulative specimen weight (red line indicates linear regression). Because the fwh1 fragment is shorter than the previously sequenced Folmer COI fragment (
For the three Romanian samples the ecological quality state of the rivers was assessed only on the expert judgment (visual assessment, Suppl. material
Discussion
Primer development and performance
Using PrimerMiner we have developed two short universal metabarcoding primer sets targeting freshwater macroinvertebrates. As previously reported, a short 150 bp barcode marker is sufficient to identify most insect taxa on species level (
In silico evaluation of the newly developed primer sets revealed that all of them showed low penalty scores, except for the fwh2R primer, where a design error was introduced causing mismatches across most taxa. Unfortunately, in silico evaluation was only carried out when preparing this manuscript, therefore a corrected version of the primer (fwhR2n) could not be tested in vitro with mock and kick samples. Compared to the fwh1 primer set, the fwhR2n primer still shows a high average penalty score of above 50, thus even the improved reverse primer version is not likely to perform particularly well for amplification of insects. The in silico evaluation also showed that the fwh1, BF+BR as well as the ArF5+ArR5 primer sets (
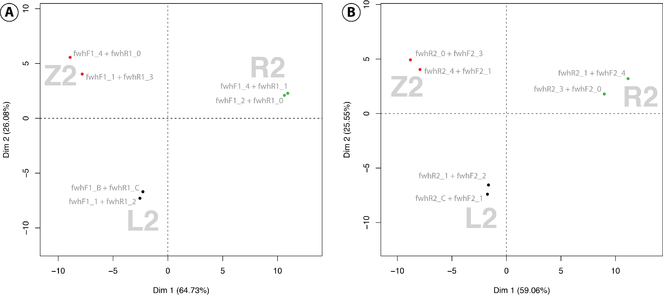
Both the fwh1 and the fwh2 primer sets (using the flawed fwhR2 primer) were additionally tested on several mock communities as well as complete kick samples. While both primer sets could clearly differentiate the three stream sites in a principal component analysis, the fwh2 primer set showed a higher primer bias when amplifying mock communities, each containing 52 freshwater macroinvertebrates. The primer set also failed to amplify the DceM mock community containing specimens of a single stonefly and was thus not included in sequencing. Perlidae specimens were also underrepresented in the multi species mock community with the fwh2 primer set, indicating strong primer bias for this group. Both the fwh1 and fwh2 primer sets detected 98% of the freshwater insects present in the multi species mock communities. While both universal primer sets show higher detection rates and reduced primer bias compared to the standard COI Folmer primer sets (
Validation of sequence / biomass relationships within species
We also used the new fwh1 primer set to test for a linear relationship of sequence abundance to specimen biomass within species, which we previously explored for the Folmer primer sets (
Conclusions
DNA metabarcoding is a powerful tool for understanding and assessing aquatic biodiversity. While there are well-designed and evaluated primer sets available to generate comparatively long amplicons (BF2+BR2), these might fail when targeting samples of highly degraded DNA. The primer sets developed here are suggested as a valuable alternative for such special cases where longer fragments are difficult to obtain. Our primer evaluation, especially of the fwh1 primer set, demonstrates the excellent performance with mock samples and the ability to clearly differentiate between the complete freshwater invertebrate communities from three Romanian streams. We therefore encourage the application of the fwh1 primer set for gut content analysis, poorly conserved museum specimens and when targeting highly degraded environmental DNA from e.g. water or soil samples.
Acknowledgements
We would like to thank Karina Battes from Babes-Bolyai University, Cluj-Napoca for kindly providing the kick samples. EEV was supported by a fellowship of the Dr. Musat V. Bodnarescu foundation. We would further like to thank the leeselab journal club proofreading this manuscript. This publication is part of the EU COST Action DNAqua-Net (CA15219).
Author contributions
VE, EEV and FL conceived the ideas and designed methodology; EEV carried out the laboratory work; VE performed bioinformatic analyses; VE and EEV led the writing of the manuscript. All authors contributed critically to the drafts and gave final approval for publication.
Conflicts of interest
The authors report no conflicts of interest. The authors alone are responsible for the content and writing of the paper.
References
- The ecology of environmental DNA and implications for conservation genetics.Conservation Genetics17(1):1‑17. https://doi.org/10.1007/s10592-015-0775-4
- Mitochondrial pseudogenes: evolution's misplaced witnesses.Trends in Ecology & Evolution16(6):314‑321. https://doi.org/10.1016/s0169-5347(01)02151-6
- Annual time-series analysis of aqueous eDNA reveals ecologically relevant dynamics of lake ecosystem biodiversity.Nature Communications8:14087. https://doi.org/10.1038/ncomms14087
- Environmental monitoring using next generation sequencing: rapid identification of macroinvertebrate bioindicator species.Frontiers in Zoology10(1):45. https://doi.org/10.1186/1742-9994-10-45
- A DNA barcode database of Australia’s freshwater macroinvertebrate fauna.Marine and Freshwater Researchhttps://doi.org/10.1071/mf16304
- Effect of marker choice and thermal cycling protocol on zooplankton DNA metabarcoding studies.Ecology and Evolution7(3):873‑883. https://doi.org/10.1002/ece3.2667
- Forensic identification of severely degraded Atlantic salmon (Salmo salar) and rainbow trout (Oncorhynchus mykiss) tissues.Investigative Genetics1(1):12. https://doi.org/10.1186/2041-2223-1-12
- DNA metabarcoding and the cytochrome c oxidase subunit I marker: not a perfect match.Biology Letters10(9):20140562‑20140562. https://doi.org/10.1098/rsbl.2014.0562
- Environmental DNA reveals that rivers are conveyer belts of biodiversity information.Nature communications7:12544. https://doi.org/10.1038/ncomms12544
- UPARSE: highly accurate OTU sequences from microbial amplicon reads.Nature Methods10(10):996‑998. https://doi.org/10.1038/nmeth.2604
- Can DNA-Based Ecosystem Assessments Quantify Species Abundance? Testing Primer Bias and Biomass—Sequence Relationships with an Innovative Metabarcoding Protocol.PLOS ONE10(7):e0130324. https://doi.org/10.1371/journal.pone.0130324
- PrimerMiner: an rpackage for development and in silicovalidation of DNA metabarcoding primers.Methods in Ecology and Evolution8(5):622‑626. https://doi.org/10.1111/2041-210x.12687
- Validation and Development of COI Metabarcoding Primers for Freshwater Macroinvertebrate Bioassessment.Frontiers in Environmental Science5https://doi.org/10.3389/fenvs.2017.00011
- Sorting things out - assessing effects of unequal specimen biomass on DNA metabarcoding.Ecology and Evolutionhttps://doi.org/10.1002/ece3.3192
- Assessing strengths and weaknesses of DNA metabarcoding-based macroinvertebrate identification for routine stream monitoring.Methods in Ecology and Evolutionhttps://doi.org/10.1111/2041-210x.12789
- Testing the potential of a ribosomal 16S marker for DNA metabarcoding of insects.PeerJ4:e1966. https://doi.org/10.7717/peerj.1966
- A Filtering Method to Generate High Quality Short Reads Using Illumina Paired-End Technology.PLoS ONE8(6):e66643. https://doi.org/10.1371/journal.pone.0066643
- DNA primers for amplification of mitochondrial cytochrome c oxidase subunit I from diverse metazoan invertebrates.Molecular marine biology and biotechnology3(5):294‑9.
- Large-Scale Biomonitoring of Remote and Threatened Ecosystems via High-Throughput Sequencing.PLOS ONE10(10):e0138432. https://doi.org/10.1371/journal.pone.0138432
- Simultaneous assessment of the macrobiome and microbiome in a bulk sample of tropical arthropods through DNA metasystematics.Proceedings of the National Academy of Sciences111(22):8007‑8012. https://doi.org/10.1073/pnas.1406468111
- Assessing streams in Germany with benthic invertebrates: development of a practical standardised protocol for macroinvertebrate sampling and sorting.Limnologica - Ecology and Management of Inland Waters34(4):349‑365. https://doi.org/10.1016/s0075-9511(04)80005-7
- Environmental Barcoding: A Next-Generation Sequencing Approach for Biomonitoring Applications Using River Benthos.PLoS ONE6(4):e17497. https://doi.org/10.1371/journal.pone.0017497
- Biological identifications through DNA barcodes.Proceedings of the Royal Society B: Biological Sciences270(1512):313‑321. https://doi.org/10.1098/rspb.2002.2218
- Environmental DNA - a review of the possible applications for the detection of (invasive) species.Stichting RAVON
- Development of a Dual-Index Sequencing Strategy and Curation Pipeline for Analyzing Amplicon Sequence Data on the MiSeq Illumina Sequencing Platform.Applied and Environmental Microbiology79(17):5112‑5120. https://doi.org/10.1128/aem.01043-13
- AmpliconDuo: A Split-Sample Filtering Protocol for High-Throughput Amplicon Sequencing of Microbial Communities.PloS one10(11):e0141590. https://doi.org/10.1371/journal.pone.0141590
- DNAqua-Net: Developing new genetic tools for bioassessment and monitoring of aquatic ecosystems in Europe.Pensoft Publishershttps://doi.org/10.5167/UZH-132075
- Random sampling causes the low reproducibility of rare eukaryotic OTUs in Illumina COI metabarcoding.PeerJ5:e3006. https://doi.org/10.7717/peerj.3006
- A new versatile primer set targeting a short fragment of the mitochondrial COI region for metabarcoding metazoan diversity: application for characterizing coral reef fish gut contents.Frontiers in Zoology10:43‑43.
- Utility of environmental DNA for monitoring rare and indicator macroinvertebrate species.Freshwater Science33(4):1174‑1183. https://doi.org/10.1086/678128
- Cutadapt removes adapter sequences from high-throughput sequencing reads.EMBnet.journal17(1):10. https://doi.org/10.14806/ej.17.1.200
- A universal DNA mini-barcode for biodiversity analysis.BMC genomics9:214. https://doi.org/10.1186/1471-2164-9-214
- Phylogenomics resolves the timing and pattern of insect evolution.Science (New York, N.Y.)346(6210):763‑7. https://doi.org/10.1126/science.1257570
- Collecting in collections: a PCR strategy and primer set for DNA barcoding of decades-old dried museum specimens.Molecular Ecology Resources15(5):1102‑1111. https://doi.org/10.1111/1755-0998.12380
- Universal and blocking primer mismatches limit the use of high-throughput DNA sequencing for the quantitative metabarcoding of arthropods.Molecular Ecology Resources15(4):819‑830. https://doi.org/10.1111/1755-0998.12355
- Who is eating what: diet assessment using next generation sequencing.Molecular ecology21(8):1931‑50. https://doi.org/10.1111/j.1365-294X.2011.05403.x
- bold: The Barcode of Life Data System (http://www.barcodinglife.org).Molecular ecology notes7(3):355‑364. https://doi.org/10.1111/j.1471-8286.2007.01678.x
- Opening the treasure chest: A DNA-barcoding primer set for most higher taxa of Central European birds and mammals from museum collections.PLOS ONE12(3):e0174449. https://doi.org/10.1371/journal.pone.0174449
- 2.7 million samples genotyped for HLA by next generation sequencing: lessons learned.BMC Genomics18(1). https://doi.org/10.1186/s12864-017-3575-z
- Are “universal” DNA primers really universal?Journal of Applied Genetics55(4):485‑496. https://doi.org/10.1007/s13353-014-0218-9
- Pyrosequencing for Mini-Barcoding of Fresh and Old Museum Specimens.PLoS ONE6(7):e21252. https://doi.org/10.1371/journal.pone.0021252
- Sequence Depth, Not PCR Replication, Improves Ecological Inference from Next Generation DNA Sequencing.PLoS ONE9(2):e90234. https://doi.org/10.1371/journal.pone.0090234
- Numerous transposed sequences of mitochondrial cytochrome oxidase I-II in aphids of the genus Sitobion (Hemiptera: Aphididae).Molecular Biology and Evolution13(3):510‑524. https://doi.org/10.1093/oxfordjournals.molbev.a025612
- Can DNA barcodes of stream macroinvertebrates improve descriptions of community structure and water quality?Journal of the North American Benthological Society30(1):195‑216. https://doi.org/10.1899/10-016.1
- Towards next-generation biodiversity assessment using DNA metabarcoding.Molecular ecology21(8):2045‑50. https://doi.org/10.1111/j.1365-294X.2012.05470.x
- Environmental DNA – An emerging tool in conservation for monitoring past and present biodiversity.Biological Conservation183:4‑18. https://doi.org/10.1016/j.biocon.2014.11.019
- Taxon-specific PCR for DNA barcoding arthropod prey in bat faeces.Molecular ecology resources11(2):236‑44. https://doi.org/10.1111/j.1755-0998.2010.02920.x
- Towards a comprehensive barcode library for arctic life - Ephemeroptera, Plecoptera, and Trichoptera of Churchill, Manitoba, Canada.Frontiers in Zoology6(1):30. https://doi.org/10.1186/1742-9994-6-30
- Ephemeroptera, Plecoptera, and Trichoptera fauna of Churchill (Manitoba, Canada): insights into biodiversity patterns from DNA barcoding.Journal of the North American Benthological Society29(3):814‑837. https://doi.org/10.1899/09-121.1
- The Trichoptera barcode initiative: a strategy for generating a species-level tree of life.Barcode of Life Data Systemshttps://doi.org/10.5883/DS-TBOL
Supplementary materials
Primers evaluated in this study
Developed fusion primers for fwh1 and fwh2 on the Illumina high throughput sequencing platform.
Overview of similarity of used inline tags for the fwh1 and fwh2 fusion primers.
Overview of the three Romanian macrozoobenthos sampling sites (Z2, L2, R2).
Overview of the macroinvertebrates composition of the three sample sites in Romania.
Overview of used tagging combinations for sample multiplexing for sequencing.
Gradient PCR optimisation for the fwh primer sets.
JAMP metabarcoding pipeline (used R commands) and expected single species mock sample haplotypes (fasta file)
Number of raw sequences obtained for each sample after demultiplexing.
OTU table for the 52 taxa mock samples sequenced with the fwh1 and fwh2 primer set.
Proportion of shared reads between the two replicates for DceM amplified with the fwh1 primer set.
Sample composition of Romanian macroinvertebrate samples.