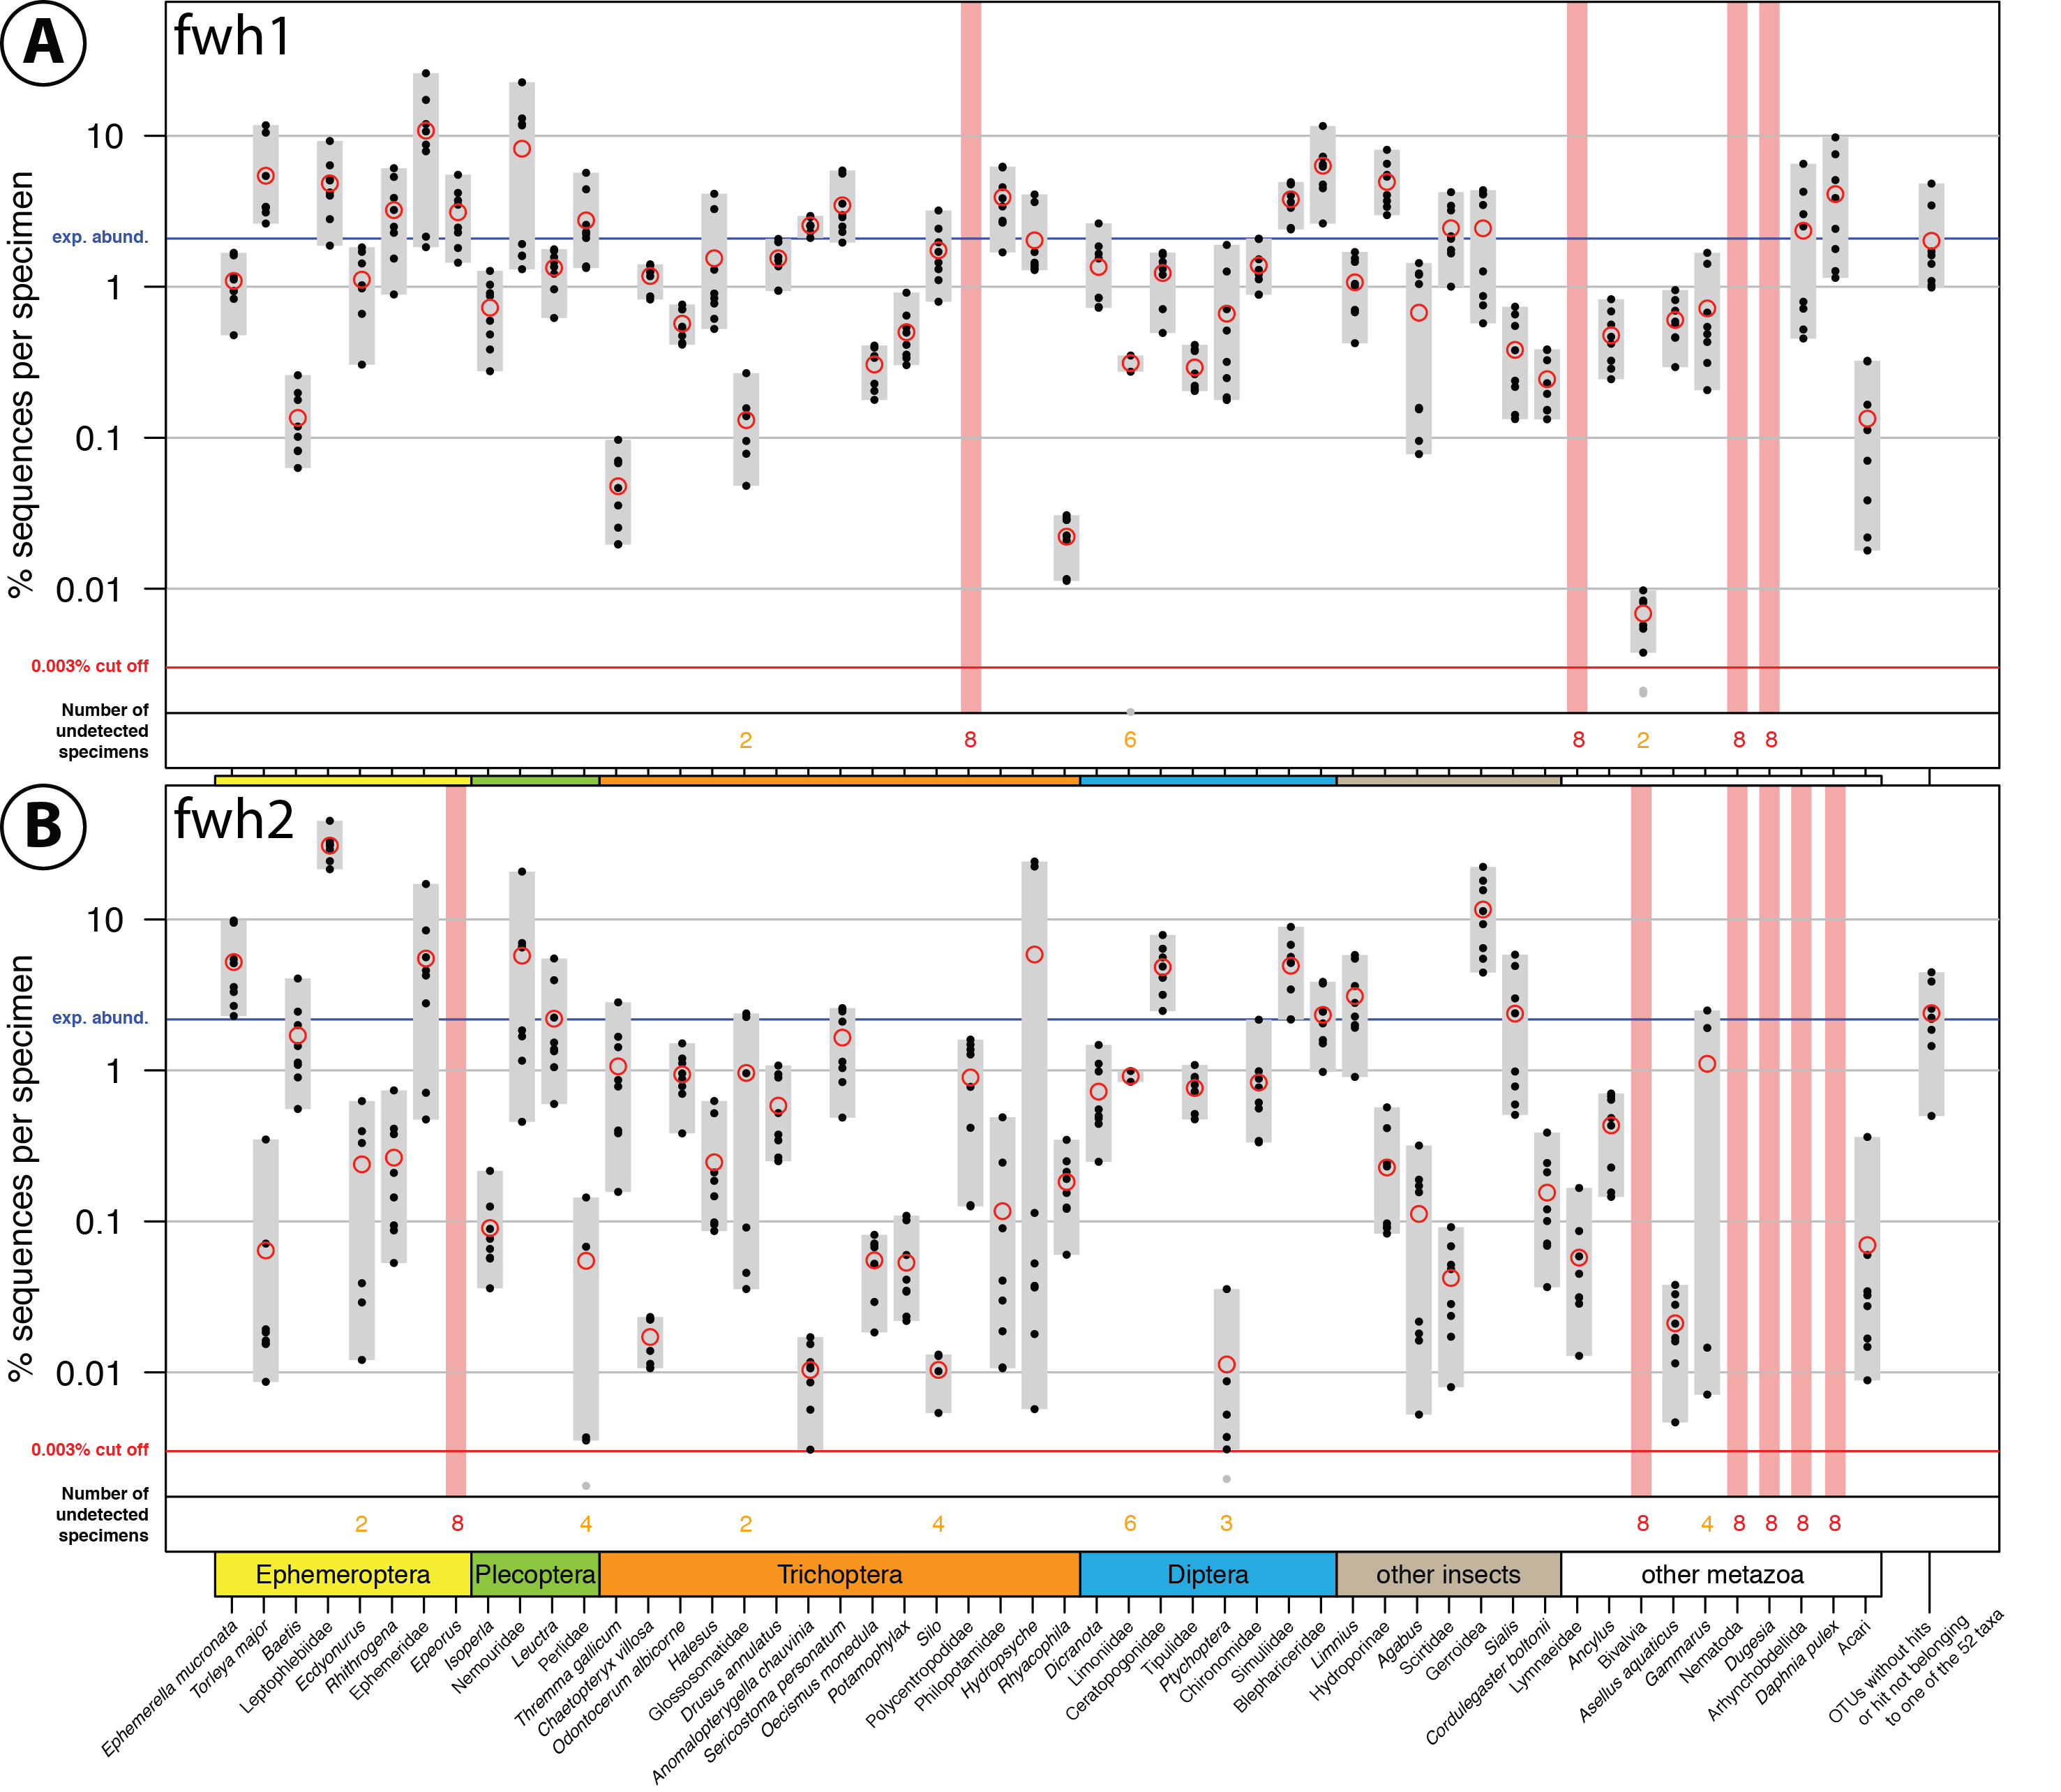
Comparison of fwh1 (A) and fwh2 (B) primer performance, both tested with the same four bulk samples with two independent PCR replicates for each sample. Each respective sample contained 52 morphologically distinct macroinvertebrate taxa ("TierMix": A, B, C & D). The 52 taxa are shown on the x-axis with the number of reads obtained for each morphotaxon indicated by black dots on the logarithmic y-axis (mean relative abundance of detected morphotaxa is indicated by red circles, replicates are plotted). Sequence abundance was normalised across the samples and the amount of tissue used in each DNA extraction. Only OTUs which had a minimum abundance of 0.003% in at least one of the four samples were included in the analysis. Number of samples for which a morphotaxon was not detected is indicated by orange and red numbers in each plot. A thick vertical line in light red indicates if a morphotaxon was not detected.