|
Metabarcoding and Metagenomics :
Applied Study
|
|
Corresponding author: Kathrin Theissinger (theissinger@uni-landau.de)
Academic editor: Kristy Deiner
Received: 18 Sep 2017 | Accepted: 21 Dec 2017 | Published: 15 Jan 2018
© 2018 Kathrin Theissinger, Anna Kästel, Vasco Elbrecht, Jenny Makkonen, Susanne Michiels, Susanne Schmidt, Stefanie Allgeier, Florian Leese, Carsten Brühl
This is an open access article distributed under the terms of the Creative Commons Attribution License (CC BY 4.0), which permits unrestricted use, distribution, and reproduction in any medium, provided the original author and source are credited.
Citation:
Theissinger K, Kästel A, Elbrecht V, Makkonen J, Michiels S, Schmidt S, Allgeier S, Leese F, Brühl C (2018) Using DNA metabarcoding for assessing chironomid diversity and community change in mosquito controlled temporary wetlands. Metabarcoding and Metagenomics 2: e21060. https://doi.org/10.3897/mbmg.2.21060
|
|
Abstract
The biocide Bacillus thuringiensis var. israelensis (Bti) is widely applied for mosquito control in temporary wetlands of the German Upper Rhine Valley. Even though Bti is considered environmentally friendly, several studies have shown non-target effects on chironomids, a key food resource in wetland ecosystems. Chironomids have been proposed as important indicators for monitoring freshwater ecosystems, however, morphological determination is very challenging. In this study, we investigated the effectiveness of metabarcoding for chironomid diversity assessment and tested the retrieved chironomid operational taxonomic units (OTUs) for possible changes in relative abundance and species diversity in relation to mosquito control actions in four temporary wetlands. Three of these wetlands were, for the first year after 20 years of Bti treatment, partly left Bti-untreated in a split field design, and one wetland has never been treated with Bti. Our metabarcoding approach detected 54 chironomid OTUs across all study sites, of which almost 70% could be identified to species level comparisons against the BOLD database. We showed that metabarcoding increased chironomid species determination by 70%. However, we found only minor significant effects of Bti on the chironomid community composition, even though Bti reduced chironomid emergence by 65%. This could be due to a time lag of chironomid recolonization, since the study year was the first year of Bti intermittence after about 20 years of Bti application in the study area. Subsequent studies will have to address if and how the chironomid community composition will recover further in the now Bti-untreated temporary wetlands to assess effects of Bti.
Keywords
Bacillus thuringensis var. israelensis (Bti), Barcode of Life Database (BOLD), chironomid saprobic index, cytochrome oxidase subunit I (COI), ecotoxicology, macrozoobenthos emergence, operational taxonomic units (OTU)
Introduction
Since 1981, the biocide Bacillus thuringiensis var. israelensis (Bti) is widely applied for mosquito (Culicidae, Diptera) control in temporary wetlands of the German Upper Rhine valley to minimize nuisance of local residents (
However, several studies have shown that Bti non-target effects are possible (reviewed in
Chironomids are a taxonomically and ecologically highly diverse group and often dominate all kinds of lotic and lentic ecosystems in terms of species abundances and biomass (
During recent years, DNA metabarcoding of whole communities has become a new powerful tool for environmental monitoring of aquatic ecosystems (
Objectives, concept and approach
In this study, DNA metabarcoding was applied to assess the distribution and species richness of chironomids in Bti-treated vs. first year Bti-untreated temporary wetlands in the Upper Rhine Valley. The study sites were part of a mosquito control area that has received regular Bti treatments for approximately 20 years (http://www.kabsev.de/1/1_2/1_2_1/index.php, accessed on 11. August 2017). Our first aim was to study the effectiveness of metabarcoding for chironomid diversity assessment as important and often overlooked freshwater bioindicator. We expected to obtain more species-level identifications based on molecular methods as compared to traditional taxonomic determination and used these data to calculate the saprobic index for the respective sites. Our second aim was to test for possible changes in the chironomid community composition of the temporary wetlands in response to mosquito control actions. Based on the above-mentioned studies we expected:
- an overall reduction in chironomid abundance at Bti-treated sites,
- a reduction in species richness of chironomids at Bti-treated sites, and therefore:
- an overall effect of Bti-treatment on chironomid community composition.
Methodology
Study sites
The study was conducted in Rhineland-Palatinate in southwest Germany close to Neustadt-Geinsheim (Fig.

Study sites in southwest Germany close to Neustadt-Geinsheim. "Stiftungsfläche" (S), "Großwald" (G), "Mitteltrumm" (M) "Lachen-Speyerdorf" (CL). S, G and M were divided into Bti-treated (T; 20 years treated) and Bti–untreated (U; first season untreated) site pairs, and CL served as control site never been treated with Bti.
For the first time after 20 years of regular Bti treatment, parts of the study area were left Bti-untreated in spring 2013 allowing for a split field design. Accordingly, S, G and M were divided into Bti-treated (T; 20 years treated) and untreated (U; first season untreated) site pairs, and CL served as control site never been treated with Bti. The helicopter application took place on April 10, 2013 using IcyPearls (Vectobac WG®, ValentBiosciences) at a concentration of 1.44 x 10⁹ ITU/ ha.
Emergence data
Insect imagines were collected weekly with emergence traps (N = 5 per site and treatment, in total 35 traps, 0.25 m2 area each) over a period of four months (April – July 2013) for 13 weeks after application (WAA; WAA 1 – WAA 13) of Bti. The preserved emergence was determined to order level and the order Diptera to family level using a Leica M80 microscope and a 10x magnification and counted per trap and sampling week. All chironomid specimens were selected for further analyses. All specimens were conserved in 70% ethanol and stored at room temperature for up to two years until DNA extraction.
Chironomid samples of all emergence traps per WAA were pooled for Bti-treated and Bti-untreated sites. For specific emergence peaks (N = 18, see Fig.
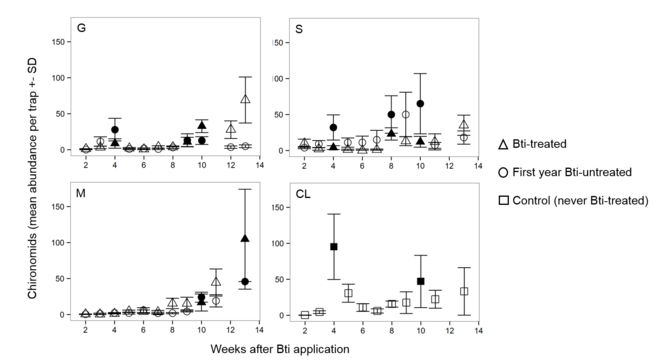
Chironomid mean abundances across all traps per site (M, G, S, and CL) for the whole sampling period. Different symbols refer to the different Bti-treatments. Filled symbols indicate pooled emergence peak samples (N = 18) used for metabarcoding.
Laboratory methods
Chironomids of emergence peaks (N = 18) were selected based on taxonomy and dried overnight at 60 °C. The specimens of each sample were grinded using a Tissue Lyser II (Qiagen, Hilden, Germany) at 30 Hz for 3 x 1 min with two sterile metal beads (3 mm, Hobbyfix, Opitec, Giebelstadt) with a brief centrifugation in between. DNA was extracted following a high salt DNA extraction protocol after (
A 322-bp fragment of the mitochondrial COI gene was amplified using the BF2 + BR1 primer set (
Bioinformatic analysis
Following the bioinformatic pipeline as previously described in
Using metabarcoding data for chironomid diversity assessment
The retrieved chironomid species list was checked for biogeographic and ecologically plausibility, i.e., if the species names were listed for Germany and are representative for temporary wetlands. If more than one species name per OTU was retrieved from BOLD with over 98% identity, we carefully examined the resulting hit table. For most hits, we then selected the biogeographically plausible species for our study region, based on the known biogeographical distribution and chironomid expert knowledge, for further ecological interpretations. If no clear decision could be made together with expert taxonomists, we followed the conservative approach to select the species name already represented in our data by another OTU. The species names retrieved in that way were categorized based on larval morphology in the context of standard water quality assessments into morphological determination “possible” (i.e., determination under 80x magnification without preparation), “difficult” (i.e., some characteristics need to be prepared and checked under greater magnification) and “impossible” (i.e., for species where the larva is not described, or do not show morphological differences within one genus, or would demand highly elaborative preparation for species determination). Using this approach, we aimed to elucidate which proportion of the chironomid species pool is neglected in standard water quality assessments, where only the easily and quickly determinable chironomid larvae are considered. We then calculated the percentage of species retrieved via metabarcoding (here emergence data) in relation to species, which would have also been possible to determine morphologically in standard water quality assessments (usually larval data). Based on available saprobic indices of the chironomid species (
Retrieved chironomid species names out of 54 obtained chironomid OTUs based on BOLD database searches. Given are OTU number(s), species names and the classification of the species determination based on larval morphology as routinely possible, difficult and impossible. Species names indicated with * are questionable.
|
morphological identification of larvae |
||||
|
OTU |
species names |
possible |
difficult |
impossible |
|
OTU_15 |
Ablabesmyia monilis (Linnaeus) |
x |
||
|
OTU_73 |
Acricotopus lucens (Zetterstedt) |
x |
||
|
OTU_11 |
Chironomus annularius (Meigen) |
x |
||
|
OTU_29 |
Chironomus curabilis* (Bel et al.) |
x |
||
|
OTU_24 |
Chironomus melanescens (Keyl) |
x |
||
|
OTU_5 |
Chironomus dorsalis (Meigen) |
x |
||
|
OTU_13 + OTU_25 + OTU_12 |
Chironomus riparius (Meigen) |
x |
||
|
OTU_42 |
Corynoneura scutellata (Winnertz) |
x |
||
|
OTU_68 |
Corynoneura coronata (Edwards) |
x |
||
|
OTU_35 |
Cricotopus sylvestris (Fabricius) |
x |
||
|
OTU_40 |
Dicrotendipes lobiger (Kieffer) |
x |
||
|
OTU_75 |
Limnophyes minimus (Meigen) |
x |
||
|
OTU_18 + OTU_64 |
Limnophyes pentaplastus (Kieffer) |
x |
||
|
OTU_34 |
Monopelopia tenuicalcar (Kieffer) |
x |
||
|
OTU_47 |
Parachironomus parilis (Walker) |
x |
||
|
OTU_4 |
Paralimnophyes longiseta (Thienemann) |
x |
||
|
OTU_33 |
Paratanytarsus grimmii (Schneider) |
x |
||
|
OTU_51 |
Paratanytarsus tenellulus (Goetghebuer) |
x |
||
|
OTU_77 |
Paratendipes albimanus (Meigen) |
x |
||
|
OTU_1 |
Polypedilum uncinatum (Goetghebuer) |
x |
||
|
OTU_45 |
Procladius fuscus* (Brundin) |
x |
||
|
OTU_19 + OTU_28 + OTU_97 |
Psectrocladius limbatellus (Holmgren) |
x |
||
|
OTU_32 |
Psectrotanypus varius (Fabricius) |
x |
||
|
OTU_66 |
Rheocricotopus fuscipes (Kieffer) |
x |
||
|
OTU_60 + OTU_264 |
Tanytarsus heusdensis (Goetghebuer) |
x |
||
|
OTU_48 |
Tanytarsus pallidicornis (Walker) |
x |
||
|
OTU_14 + OTU_137 |
Tanytarsus usmaensis (Pagast) |
x |
||
|
OTU_7 |
Telmatopelopia nemorum (Goetghebuer) |
x |
||
|
OTU_26 |
Xenopelopia nigricans (Fittkau) |
x |
||
|
OTU_41 + OTU_79 |
Zavrelimyia barbatipes (Kieffer) |
x |
||
|
N = 38 |
N = 30 |
N = 7 |
N = 5 |
N = 18 |
Saprobic Index (SI) calculations per site (N = 4) across the whole sampling period based on 14 species retrieved from our data set for which the SI is available. Given are the species saprobic values (s), weights (w) as well as the species sequence frequencies (h) summed over all traps and sampling time points.
|
Species names |
s |
w |
h [G] |
h [S] |
h [M] |
h [CL] |
|
Ablabesmyia monilis (Linnaeus) |
2.3 |
2 |
13 |
100,034 |
269 |
6 |
|
Chironomus riparius (Meigen) |
3.5 |
3 |
21,341 |
63,995 |
47,395 |
75 |
|
Corynoneura scutellata (Winnertz) |
1.7 |
2 |
80 |
17 |
2,622 |
237 |
|
Cricotopus sylvestris (Fabricius) |
2.6 |
2 |
6 |
13,553 |
7 |
11 |
|
Limnophyes pentaplastus (Kieffer) |
1.3 |
2 |
17 |
800 |
3 |
54,508 |
|
Monopelopia tenuicalcar (Kieffer) |
0.8 |
4 |
8 |
6,828 |
0 |
0 |
|
Paratendipes albimanus (Meigen) |
2.3 |
2 |
0 |
136 |
0 |
0 |
|
Psectrocladius limbatellus (Holmgren) |
1.8 |
3 |
2,588 |
65,009 |
18 |
1,331 |
|
Psectrotanypus varius (Fabricius) |
2.8 |
1 |
2,767 |
2,156 |
4,273 |
0 |
|
Rheocricotopus fuscipes (Kieffer) |
2.2 |
3 |
0 |
0 |
0 |
120 |
|
Tanytarsus heusdensis (Goetghebuer) |
1.4 |
1 |
4 |
857 |
0 |
0 |
|
Tanytarsus pallidicornis (Walker) |
1.8 |
1 |
2 |
1,426 |
0 |
0 |
|
Xenopelopia nigricans (Fittkau) |
0.8 |
2 |
403 |
114 |
16,913 |
0 |
|
Zavrelimyia barbatipes (Kieffer) |
1.0 |
3 |
1 |
157 |
3,266 |
0 |
|
SI |
3.3 |
2.5 |
2.8 |
1.3 |
Bti effects on chironomid community composition
To test whether the abundance data of emerged chironomids differed among Bti-treated and Bti-untreated sites (including the control site) for pooled samples of WAA 1 - WAA 4 (first emergence peak) and WAA 1 - WAA 13 (whole sampling period) a generalized linear mixed effect model (GLMM) (packages "nlme" v. 3.1-117,
To test for differences in chironomid species richness between Bti-treated and Bti-untreated sites (including the control site), a Welch test was applied to the total number of OTUs and based on retrieved species names.
To test the hypothesis that the chironomid community composition differed between treatments, an adonis analysis (nonmetrical permutational MANOVA equivalent,
All analyses were conducted in R (https://www.R-project.org). For all multivariate analyses, the Hellinger transformation was chosen to give less weight to the few high abundant OTUs, since the abundance data were highly left-skewed with few taxa reaching abundances several orders of magnitude higher than those of the less abundant species (
Results
Emergence data
In total, 11,589 emerged insects were collected, comprising of 17 taxa groups (Chironomidae: 78%; Culicidae: 14%; Trichoptera: 4%; Chaoboridae: 2%; Brachycera: 1%, other: 1%). On the Bti-treated sites 27 mosquito individuals were collected in the emergence traps, while on the Bti-untreated sites 1,006 mosquitoes emerged. Based on morphological identification 9,033 adult chironomids were collected. The number of chironomid specimens per emergence trap across all sites varied from 1 (Bti-treated site) to 1,239 (first year Bti-untreated site).
Emergence of chironomids fluctuated over time with varying emergence peaks at the Bti-untreated sites (Fig.
Bioinformatic analyses
In total 20,805,626 raw reads were generated by the MiSeq run with good read quality (Q30 ≥ 76.7% of reads). Raw data are available at NCBI SRA archive (accession number SRR4244505; https://www.ncbi.nlm.nih.gov/sra/?term=SRR4244505). After demultiplexing, merging and trimming of PCR primers 8,869,048 sequences were used for further analysis. The number of sequences in each sample was significantly correlated (p < 0.001, adj. R2=0.942) with the abundance of specimens per sample (Suppl. material
OTU clustering analysis resulted in 442 OTUs. After application of the previously defined quality standards (0.003% minimum abundance) 89 OTUs were retained and used for subsequent analyses. The BOLD database searches identified 54 of the 89 OTUs (60.7%) as chironomids (Suppl. material
Using metabarcoding data for chironomid diversity assessment
In total 30 chironomid species were detected in the metabarcoding data set, with six species being assigned to 2-3 OTUs respectively (Table
Of the 30 retrieved species, seven species can be routinely determined (cost and time efficient) based on larval morphology in ecological water assessments, whereas the remaining species are difficult (N = 5) or impossible (N = 18) to determine based on larval morphology (Table
The chironomid SI was calculated based on the available saprobic value for 14 chironomid species (45.2%) of our data set Table
Bti effects on chironomid community composition
The abundance of emergent chironomids until WAA 4 at the Bti-treated sites was reduced by 64.99% compared to the abundance in the Bti-untreated sites (GLMM t = 11.29, p = 0.008, df = 2). After WAA 13, slightly more chironomids hatched at the Bti-treated vs. Bti-untreated sites (2,132 vs 1,800 individuals, respectively). However, this difference was not statistically significant (GLMM t = -0.239884, df = 2, p = 0.833).
Neither the number of OTU per sample (Welch two sample t-test, t = 1.33, p = 0.20) nor the number of species assigned from the OTU based on the data base (Welch two sample t-test, t = 1.45, p = 0.17) were significantly different between Bti-treated and Bti-untreated site pairs.
The adonis model of crossed Bti-treatment * site effects (with the variation from time implemented as groups (strata) within which permutations are constrained) explained 51% of the variation of the multivariate chironomid community composition, 34% of which were due to the differences within sites (Table
Results from the adonis analysis on the effect of treatment over time. The variation due to differences between sampling events was taken into account by the ”strata = time” argument in the model. Df = degrees of freedom; F model = F statistic of the respective sub model.
|
Df |
Sums of Squares |
F Model |
R2 |
Pr(>F) |
||
|
Site (time) |
3 |
0.82 |
1.89 |
0.34 |
0.003 |
*** |
|
Bti Treatment |
1 |
0.30 |
2.05 |
0.12 |
0.02 |
* |
|
Site (time) : Bti-Treatment |
2 |
0.13 |
0.90 |
0.05 |
0.45 |
|
|
Residuals |
8 |
1.15 |
0.48 |
|||
|
Total |
13 |
2.40 |
1.00 |
Discussion
Using metabarcoding data for chironomid diversity assessment
With our metabarcoding approach we detected 54 chironomid OTUs across all study sites, of which almost 70% could be identified to species level using the BOLD database. Even though we did not have a specific reference database for our study system (e.g.
For 11 OTUs we retrieved more than one species name with a sequence similarity of 97.82–100% (Suppl. material
The information benefit of metabarcoding by obtaining species names strongly depends on the quality of the database. For 17 chironomid OTUs (31.5%) no species identification could be obtained (Suppl. material
By applying metabarcoding we obtained 70% more chironomid species identifications than would have been possible based on traditional taxonomic determination of larval samples (Table
The saprobic index per site based on 14 chironomid species and their sequence abundancies ranged from 1.3 (control site) to 3.3 in one of the Bti treated sites (Table
The advantages of metabarcoding over traditional monitoring for water quality assessments is gaining increasing attention. Since
Bti effects on chironomid community composition
In our study sites we could show that a considerable number of chironomids live in these wetlands subjected to mosquito control. The uptake and the mode of action of Bti is similar for mosquitos and chironomids (
The chironomid abundance until WAA 4 was significantly reduced by almost 65% in the Bti-treated sites compared to the Bti-untreated sites, including the never Bti-treated control site. At the control site this spring peak was especially pronounced, indicating that WAA 4 (here: begin of May) is a key time period for the overall chironomid emergence in this area. The observed abundance reduction can be explained by the recent Bti treatment, which killed not only the mosquito larvae but also the chironomid larvae, predominantly affecting freshly hatched larvae. Especially first instar larvae of C. riparius were shown to be highly affected by Bti in laboratory experiments while older larvae were less sensitive (
The adonis analysis corroborated the assumption that site and time (seasonality) had a dominant effect on chironomid communities (Table
Even though site and time influenced species composition the most, the first year of Bti intermittence significantly altered the chironomid community as well. This Bti effect was rather low (12%, Table
Conclusions
We showed the effectiveness of metabarcoding for chironomid diversity assessments, which led to a 70% increase in species determination compared to determination based on larval morphology. Thus, metabarcoding improves data quality by generating taxonomic resolution. Regarding the question of non-target effects of Bti on the chironomid community, our study found only minor significant effects even though Bti reduced the chironomid emergence by 65%. This could be due to a time lag of chironomid recolonization, since the study year was the first year of Bti intermittence after around 20 years of Bti application in the study area. A follow-up study after a few years of Bti intermittence could result in a more obvious recovery of the chironomid community composition in the Bti-untreated temporary wetlands.
Acknowledgements
This work has been financed by the Ministerium für Wissenschaft, Weiterbildung und Kultur Rheinland-Pfalz, Germany, in the frame of the programme "Research initiative", project AufLand.We are grateful to the representatives of the town Neustadt an der Weinstrasse and to the Stiftung Natur und Umwelt Rheinland-Pfalz for supporting this project ideally and financially. FL and VE are supported by the EU COST (European Cooperation in Science and Technology) Action DNAqua-Net (CA15219). We thank Martin Spies, Zoologische Staatssammlung München, for advices with questionable species and Christoph Leeb for generating the map of the study sites. Furthermore, we would like to thank Torbjørn Ekrem, Iliana Bista and Kristy Deiner for valuable comments substantially improving this manuscript.
Funding program
This work has been financed by the Ministerium für Wissenschaft, Weiterbildung und Kultur Rheinland-Pfalz, Germany, in the frame of the programme "Research initiative", project AufLand.
Author contributions
Sampling: AK, SA; Laboratory work: AK, VE; Bioinformatic data analyses: VE; Biological data analyses: KT, AK, JM, SM; Multivariate statistics: SIS; Study design and supervision: KT; CB; FL; Manuscript writing: KT; AK, equal contribution.
All authors edited and commented on the manuscript draft.
Conflicts of interest
The authors declare that there is no conflict of interest.
References
- Susceptibility of some Florida chironomids and mosquitoes to various formulations of Bacillus thuringiensis var. israelensis.Journal of Economic Entomology74:672‑677. https://doi.org/10.1093/jee/74.6.672
- Universal and rapid salt-extraction of high quality genomic DNA for PCR-based techniques.Nucleic Acids Research25(22):4692‑4693. https://doi.org/10.1093/nar/25.22.4692
- Molecular and morphological methods reveal cryptic diversity and three new species of Nearctic Micropsectra (Diptera: Chironomidae).Freshwater Science32(3):892‑921. https://doi.org/10.1899/12-026.1
- Permutation tests for univariate or multivariate analysis of variance and regression.Canadian Journal of Fisheries and Aquatic Sciencehttps://doi.org/10.1139/cjfas-58-3-626
- The Chironomidae: Biology and Ecology of Non-Biting Midges.Chapman and Hall,London.
- Invertebrates in freshwater wetlands: an international perspective on their ecology.Springer
- The use of Bacillus thuringiensis subsp. isrealensis (Bti) against mosquitoes, with special emphasis on the ecological impact.Israel Journal of Entomology63‑69.
- 15 years of pond assessment in Britain: results and lessons learned from the work of Pond Conservation.Aquatic Conservation: Marine and Freshwater Ecosystems15:693‑714. https://doi.org/10.1002/aqc.745
- Annual time-series analysis of aqueous eDNA reveals ecologically relevant dynamics of lake ecosystem biodiversity.Nature Communications 8: 14087.https://doi.org/10.1038/ncomms14087
- Effects of Bacillus thuringensis var. israelenisis on target and nontarget organisms: a review of laboratory and field experiments.Biocontrol Science and Technology10(5):517‑561. https://doi.org/10.1080/095831500750016361
- Phylogenetic diversity of geometrid moths decreases with elevation in the tropical Andes.Ecography36:1247‑1253. https://doi.org/10.1111/j.1600-0587.2013.00030.x
- The response of Chironomidae to sediment pollution and other environmental characteristics in urban wetlands.Freshwater Biology52(12):2444‑2462. https://doi.org/10.1111/j.1365-2427.2007.01840.x
- Environmental monitoring using next generation sequencing: rapid identification of macroinvertebrate bioindicator species.Frontiers in Zoology10:45. https://doi.org/10.1186/1742-9994-10-45
- From barcoding single individuals to metabarcoding biological communities: Towards an integrative approach to the study of global biodiversity.Trends in Ecology and Evolution29(10):566‑571. https://doi.org/10.1016/j.tree.2014.08.001
- Chironomids (Diptera, Nematocera) of temporary pools - an ecological case study. PhD Thesis.University Heidelberg,Heidelberg.
- UPARSE: Highly accurate OTU sequences from microbial amplicon reads.Nature Methods 10: 996-998.https://doi.org/10.1038/nmeth.2604
- Females do count: documenting Chironomidae (Diptera) species diversity using DNA barcoding.Organisms Diversity and Evolution10:397‑408. https://doi.org/10.1007/s13127-010-0034-y
- A comprehensive DNA sequence library is essential for identification with DNA barcodes.Molecular Phylogenetics and Evolution43:530‑542. https://doi.org/10.1016/j.ympev.2006.11.021
- Can DNA-based ecosystem assessments quantify species abundance? Testing primer bias and biomass - sequence relationships with an innovative metabarcoding protocol.PLoS One10(7):e0130324. https://doi.org/10.1371/journal.pone.0130324
- Validation and development of COI metabarcoding primers for freshwater macroinvertebrate bioassessment.Frontiers in Environmental Sciences 5:1‑16. https://doi.org/10.3389/fenvs.2017.00011
- Assessing strengths and weaknesses of DNA metabarcoding-based macroinvertebrate identification for routine stream monitoring.Methods in Ecology and Evolution 8(10): 1265-1275.https://doi.org/10.1111/2041-210X.12789
- Global diversity of non-biting midges (Chironomidae; Insecta-Diptera) in freshwater.Hydrobiologia595:447‑455. https://doi.org/10.1007/978-1-4020-8259-7_45
- DNA primers for amplification of mitochondrial cytochrome c oxidase subunit I from diverse metazoan invertebrates.Molecular Marine Biology and Biotechnology3:294‑299.
- Large-scale biomonitoring of remote and threatened ecosystems via high-throughput sequencing.PLoS One 10(10): e0138432.https://doi.org/10.1371/journal.pone.0138432
- First audit of macroinvertebrate samples from an EU Water Framework Directive monitoring program: human error greatly lowers precision of assessment results.Journal of the North American Benthological Society29(4):1279‑1291. https://doi.org/10.1899/09-183.1
- Environmental Barcoding: A Next-Generation Sequencing Approach for Biomonitoring Applications Using River Benthos.PLoS One 6(4): e17497.https://doi.org/10.1371/journal.pone.0017497
- Barcoding Animal Life: Cytochrome c Oxidase Subunit 1 Divergences among Closely Related Species.Proceedings of the Royal Society of London B: Biological Sciences270:96‑99. https://doi.org/10.1098/rsbl.2003.0025
- Effects of methoprene and Bti (Bacillus thuringiensis var. israelensis) on non-target insects.Hydrobiologia308:219‑227. https://doi.org/10.1007/BF00006873
- Indirect effects of mosquito control using Bti on dragonflies and damselflies (Odonata) in the Camargue.Insect Conservation and Diversity9:161‑169. https://doi.org/10.1111/icad.12155
- Reliable, verifiable and efficient monitoring of biodiversity viametabarcoding.Ecology Letters16:1245‑1257. https://doi.org/10.1111/ele.12162
- Decreasing Bacillus thuringiensis israelensis sensitivity of Chironomus riparius larvae with age indicates potential environmental risk for mosquito control.Scientific Reports 7: 13565.https://doi.org/10.1038/s41598-017-14019-2
- Trace DNA from insect skins: a comparison of five extraction protocols and direct PCR on chironomid pupal exuviae.Molecular Ecology Resources16(1):353‑363. https://doi.org/10.1111/1755-0998.12446
- An update on DNA barcoding: low species coverage and numerous unidentified sequence.Cladistics28:639‑644. https://doi.org/10.1111/j.1096-0031.2012.00408.x
- No association between the use of Bti for mosquito control and the dynamics of non-target aquatic invertebrates in French coastal and continental wetlands.Science of The Total Environment553:486‑494. https://doi.org/10.1016/j.scitotenv.2016.02.096
- The parthenogenetic midge of water supply systems, Paratanytarsus grimmii (Schneider) (Diptera: Chironomidae).Bulletin of Entomological Research78:317‑328. https://doi.org/10.1017/S0007485300013080
- Numerical ecology.Elsevier,Amsterdam.
- Toxicity of Bacillus thuringiensis var. israelensis to chironomids in pond mesocosms.Ecotoxicology7:343‑354. https://doi.org/10.1023/A:1008867815244
- Distribution of Chironomidae (Diptera) in the river continuum.Chironomids: from genes to ecosystems.CSIRO,Melbourne,257-271pp.
- Plant diversity and conservation value of continental temporary pools.Biological Conservation158:393‑400. https://doi.org/10.1016/j.biocon.2012.08.024
- Production of wetland Chironomidae (Diptera) and the effects of using Bacillus thuringiensis israelensis for mosquito control.Bulletin of Entomological Research100(01):117‑125. https://doi.org/10.1017/S0007485309990137
- Spatio-temporal pattern of the Chironomidae community: Toward the use of non-biting midges in bioassessment programs.Aquatic Ecology47(1):37‑55. https://doi.org/10.1007/s10452-012-9423-y
- Fauna Aquatica Austriaca.Wasserwirtschaftskataster, Bundesministerium f. Land- und Forstwirtschaft,Wien.
- Fauna Aquatica Austriaca, Katalog zur autökologischen Einstufung aquatischer Organismen Österreichs.Wasserwirtschaftskataster, Bundesministerium für Land- und Forstwirtschaft, Umwelt und Wasserwirtschaft,Wien.
- Ecological effects of mosquito control on zooplankton, insects, and birds.Environmental Toxicology and Chemestry18(3):549‑559. https://doi.org/10.1002/etc.5620180325
- vegan: Community Ecology Package. R package.2.4-1. URL: https://CRAN.R-project.org/package=vegan
- The role of mosquitoes in the diet of adult dragon and damselflies (Odonata).Journal of American Mosquito Control Association31(2):187‑189. https://doi.org/10.2987/14-6476R
- Impact of environmental factors on the toxicity of Bacillus thuringiensis var. israelensis ips82 to Chironomus kiiensis.Journal of American Mosquito Control Association21:59‑63. https://doi.org/10.2987/8756-971X(2005)21[59:IOEFOT]2.0.CO;2
- nlme: linear and nonlinear mixed effects models. R package.3.1-128. URL: http://CRAN.R-project.org/package=nlme
- Red flag for green spray: adverse trophic effects of Bti on breeding birds.Journal of Applied Ecology47(4):884‑889. https://doi.org/10.1111/j.1365-2664.2010.01821.x
- Environmental factors, spatial variation, and specific requirements of Chironomidae in Mediterranean reference streams.Journal of the North American Benthological Society28:247‑265. https://doi.org/10.1899/07-172.1
- BOLD: The Barcode of Life Data System (www.barcodinglife.org).Molecular Ecology Notes7:355‑364. https://doi.org/10.1111/j.1471-8286.2006.01678.x
- Non-biting midges in biodiversity conservation and environmental assessment: findings from boreal freshwater ecosystems.Ecological Indications11:1057‑1064. https://doi.org/10.1016/j.ecolind.2010.12.002
- Die Dipteren-Fauna der Kleingewässer im Bergrutschgebiet Hirschkopf bei Mössingen (Landkreis Tübingen, Baden-Württemberg), unter besonderer Berücksichtigung der Chironomidae.Lauterbornia80:1057‑1064.
- Microbial larvicides for the control of nuisance aquatic midges (Diptera: Chironomidae) inhabiting mesocosms and man-made lakes in California.Journal of the American Mosquito Control Association7(1):56‑62.
- Chironomids from Southern Alpine running waters: ecology, biogeography.Hydrobiologia562:231‑246. https://doi.org/10.1007/s10750-005-1813-x
- Kommentiertes Verzeichnis der auf dem Gebiet der Bundesrepublik Deutschland nachgewiesenen Chironomiden-Arten (Insecta; Diptera).Abhandlungen und Berichte des Museums der Natur Gotha19:36‑70.
- Individual and interactive effects of a predator and con-trophic species on mosquito populations.Ecological Applications15(2):587‑598. https://doi.org/10.1890/03-5191
- Chironomid communities as water quality indicators.Ecography2(2):65‑74. https://doi.org/10.1111/j.1600-0587.1979.tb00683.x
- Exploring unknown life stages of Arctic Tanytarsini (Diptera: Chironomidae) with DNA barcoding.Zootaxa2743:27‑39.
- Can DNA barcodes of stream macroinvertebrates improve descriptions of community structure and water quality?Journal of the North American Benthological Society30:195‑216. https://doi.org/10.1899/10-016.1
- Towards next-generation biodiversity assessment using DNA metabarcoding.Molecular Ecology21(8):2045‑2050. https://doi.org/10.1111/j.1365-294X.2012.05470.x
- Susceptibility of Chironomus tepperi (Diptera: Chironomidae) to Bacillus thurengiensis serovar israelensis.Journal of the Australian Entomological Society303‑304. https://doi.org/10.1111/j.1440-6055.1985.tb00248.x
- Macrozoobenthos of floodplain waters of the rivers rhine and meuse in the Netherlands: A structural and functional analysis in relation to hydrology.River Research and Applications6(4):265‑277.
- Evaluating large‐scale effects of Bacillus thuringiensis var. israelensis on non‐biting midges (Chironomidae) in a eutrophic urban lake.Freshwater Biology53(10):2117‑2128. https://doi.org/10.1111/j.1365-2427.2008.02043.x
- Modern Applied Statistics with R.4.Springer,NY. [ISBN0-387-95457-0]
- The biology of temporary waters.Oxford University Press,Oxford.
- Impact of Bacillus thuringiensis var. israelensis on larvae of Chironomusthummi thummi and Psectrocladius psilopterus (Diptera: Chironomidae).Journal of Invertebrate Pathology74:39‑47. https://doi.org/10.1006/jipa.1999.4852
- Biodiversity soup: Metabarcoding of arthropods for rapid biodiversity assessment and biomonitoring.Methods in Ecology and Evololution3(4):613‑623. https://doi.org/10.1111/j.2041-210X.2012.00198.x
- The Trichoptera barcode initiative: a strategy for generating a species-level Tree of Life.Philosophical Transactions B. 371: 20160025.https://doi.org/10.1098/rstb.2016.0025
Supplementary materials
We provide all information regarding the library preparation.
Pipeline used for bioinformatic processing of metabarcoding data in Theissinger et al.
We pooled the library according to the number of specimens per sample and could show that our read abundance highly correlates with specimen abundance. Thus, we could use the read abundancies as surrogates for relative species abundancies.
OTU ID, taxonomy of identified species, BOLD Bin, sequence abundancies per site an time and OTU sequences