|
||
|
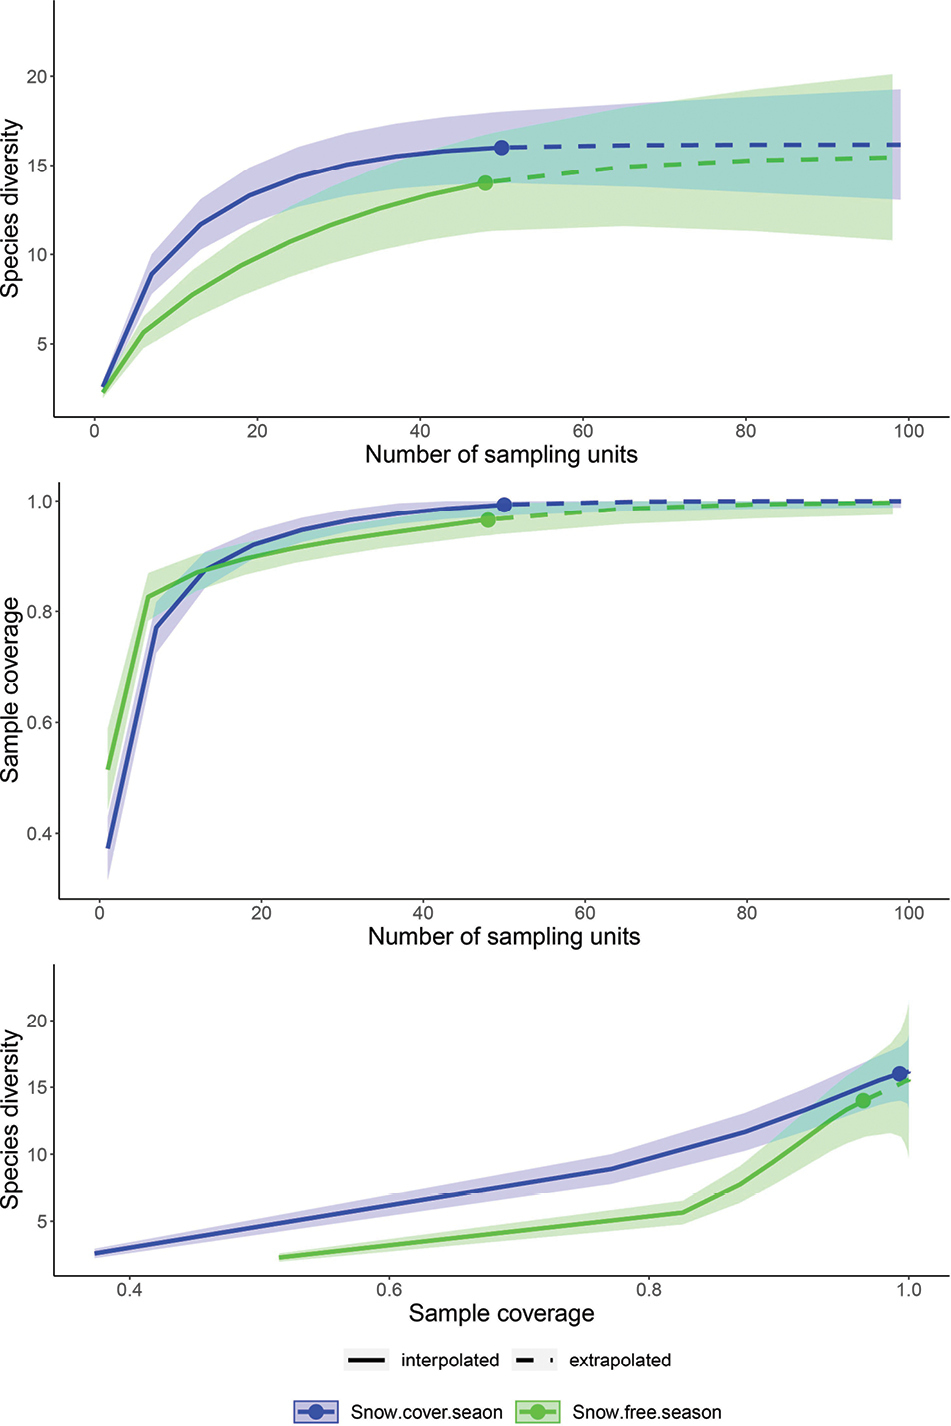
Rarefaction and extrapolation curves produced for Eurasian otter scats from HNR in snow-cover and snow-free season using iNEXT. Figure on the top represents sample size-based R/E curve, Figure in the middle represents sample completeness curve and Figure at the bottom represents coverage-based R/E curve. |