|
||
|
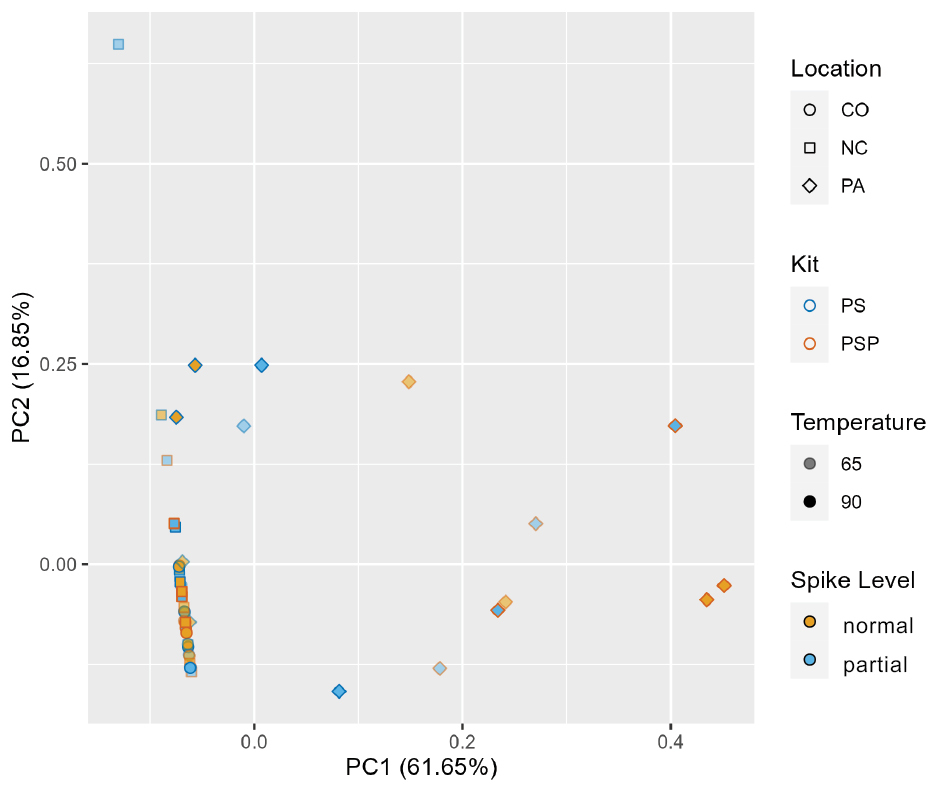
Principal component analysis of read counts for amplicon sequence variants belonging to five key plant families in spiked soil samples (partial and normal) collected from Colorado (CO; circles), North Carolina (NC; squares) and Pennsylvania (PA; diamonds) determined by ITS2 DNA metabarcoding. The outline color of the shape denotes the kit (blue = PS [PowerSoil]; or orange = PSP [PowerSoil Pro]), fill color of the shape denotes spike level (blue = partial; orange = normal) and the color intensity denotes incubation temperature (light, 65 °C; dark, 90 °C). Axes represent the first and second principal components with percent variance explained in parentheses. |