|
||
|
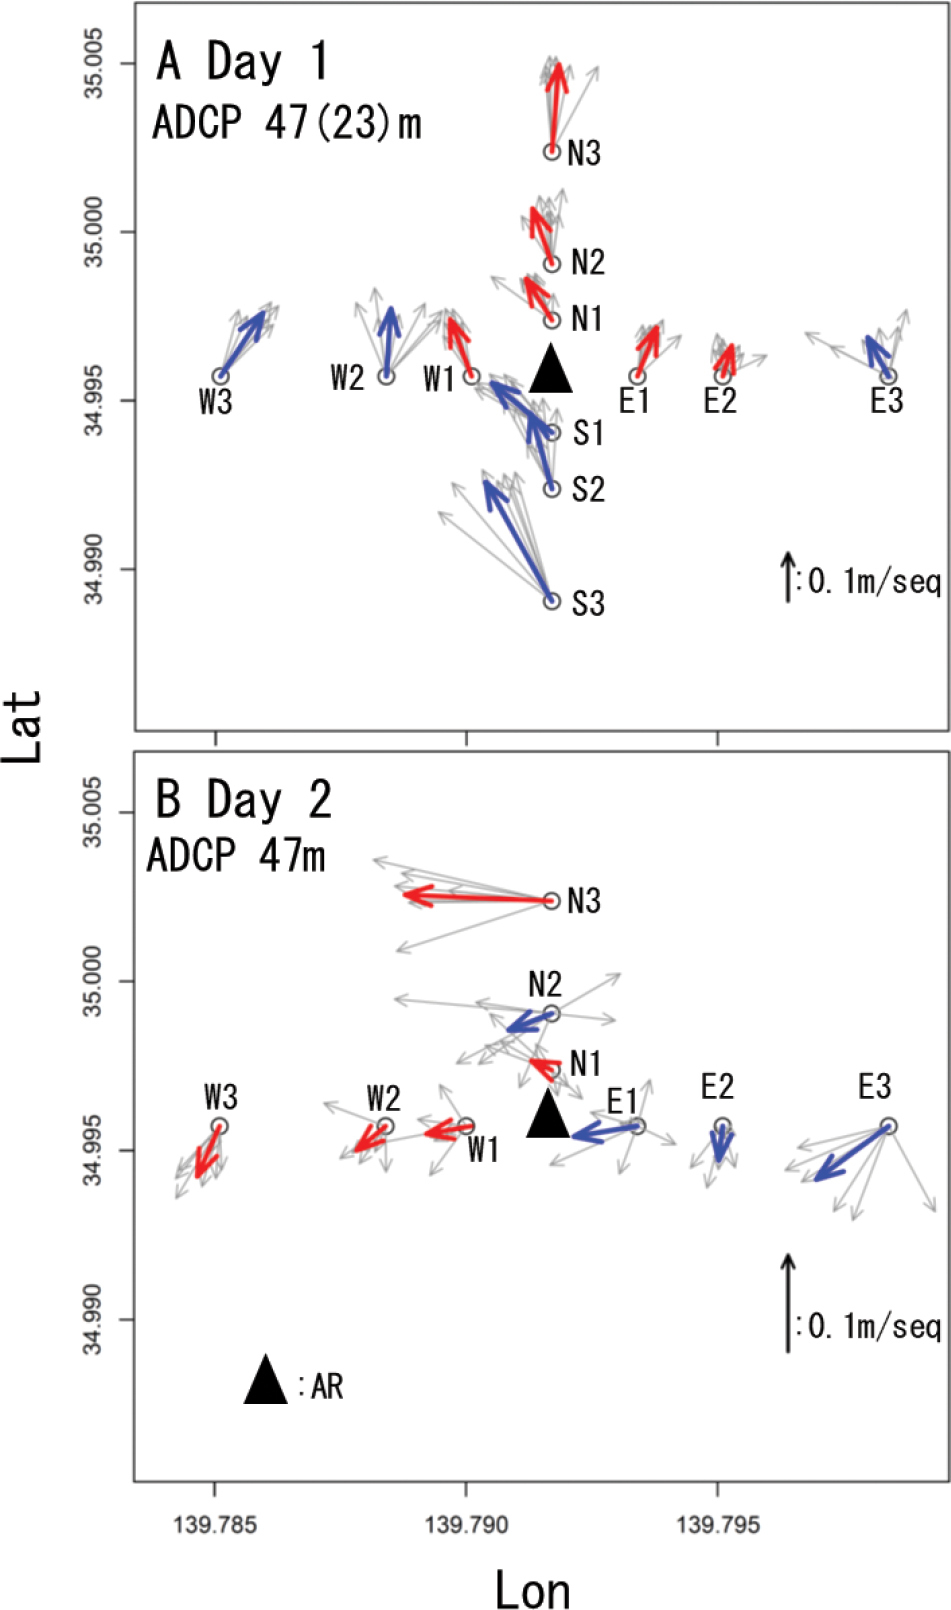
Current direction and velocity at each station on Day 1 (A) and Day 2 (B). Blue and red arrows indicate the mean of 7-min ADCP data and show the upstream (Dir < 0) and downstream (Dir > 0) currents, respectively. Gray arrows show the current and velocity mean of each minute. |