|
||
|
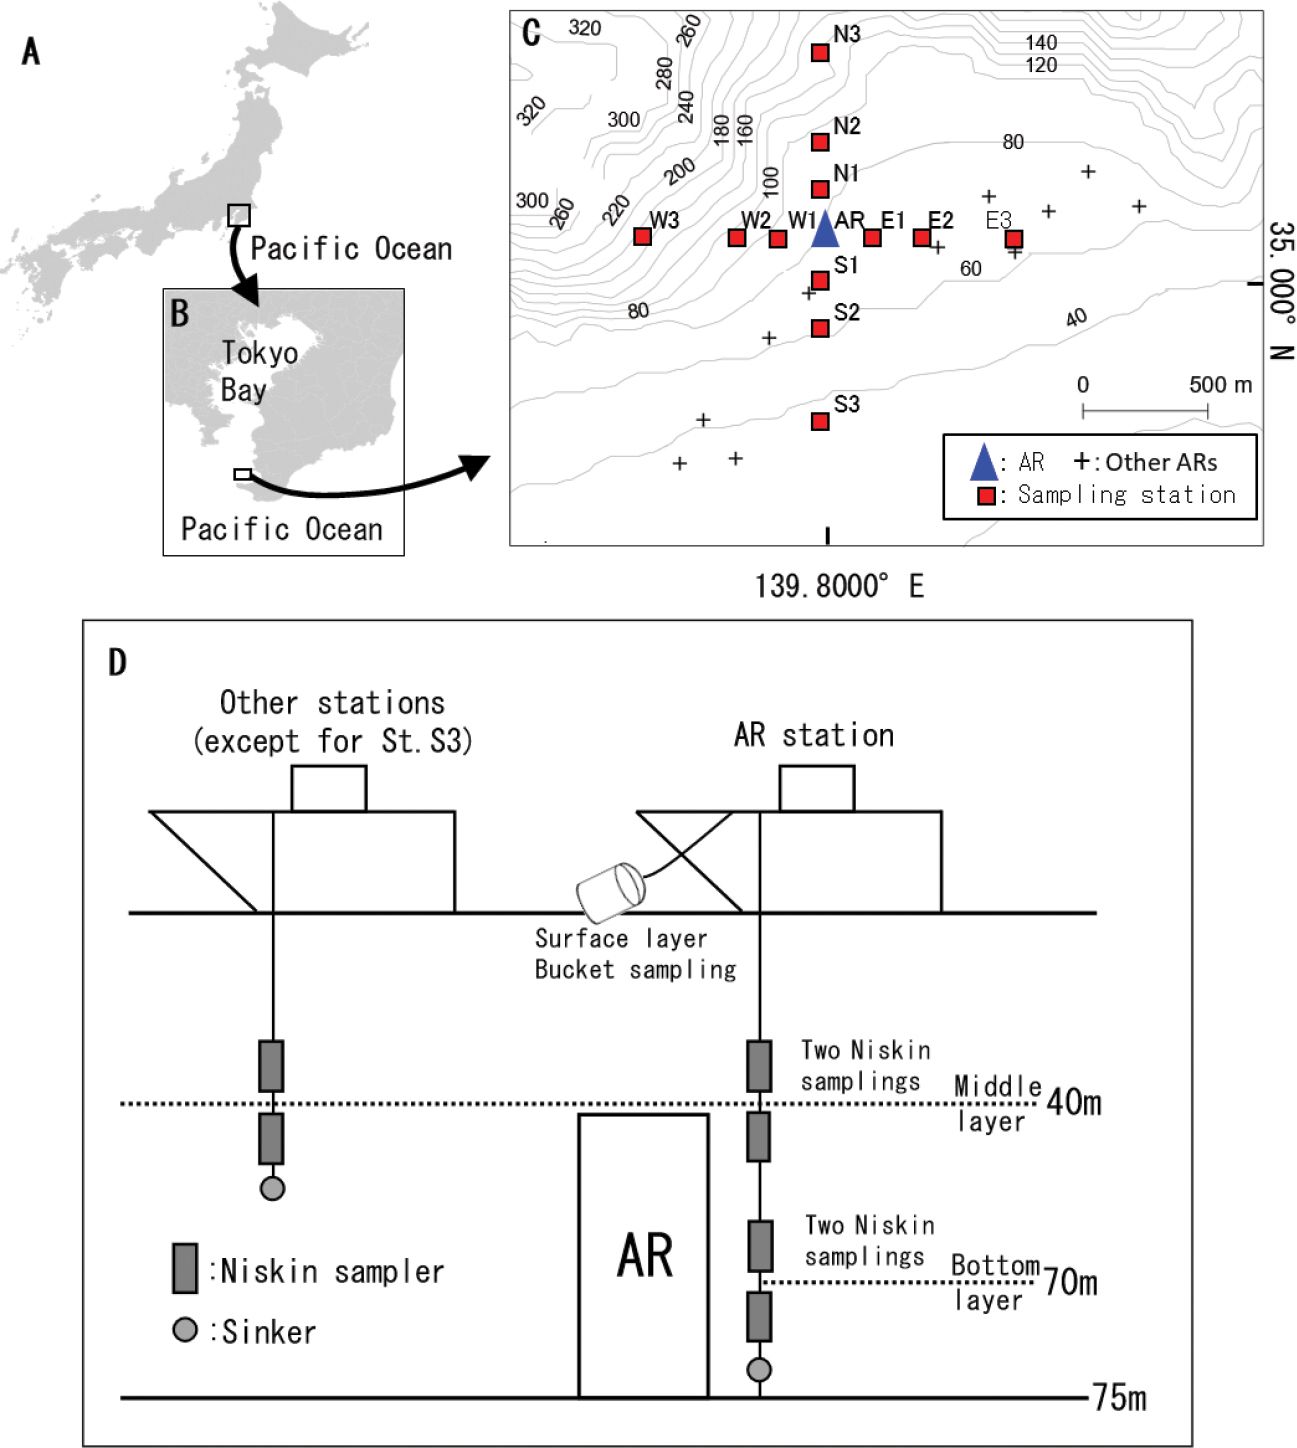
Maps showing the wider sampling area encompassing Japan (A), Tokyo Bay (B), and sampling stations (C). Schematic diagram of the water sampling method (D). |
|
||||||||
| Part of: Inoue N, Sato M, Furuichi N, Imaizumi T, Ushio M (2022) The relationship between eDNA density distribution and current fields around an artificial reef in the waters of Tateyama Bay, Japan. Metabarcoding and Metagenomics 6: e87415. https://doi.org/10.3897/mbmg.6.87415 |