|
||
|
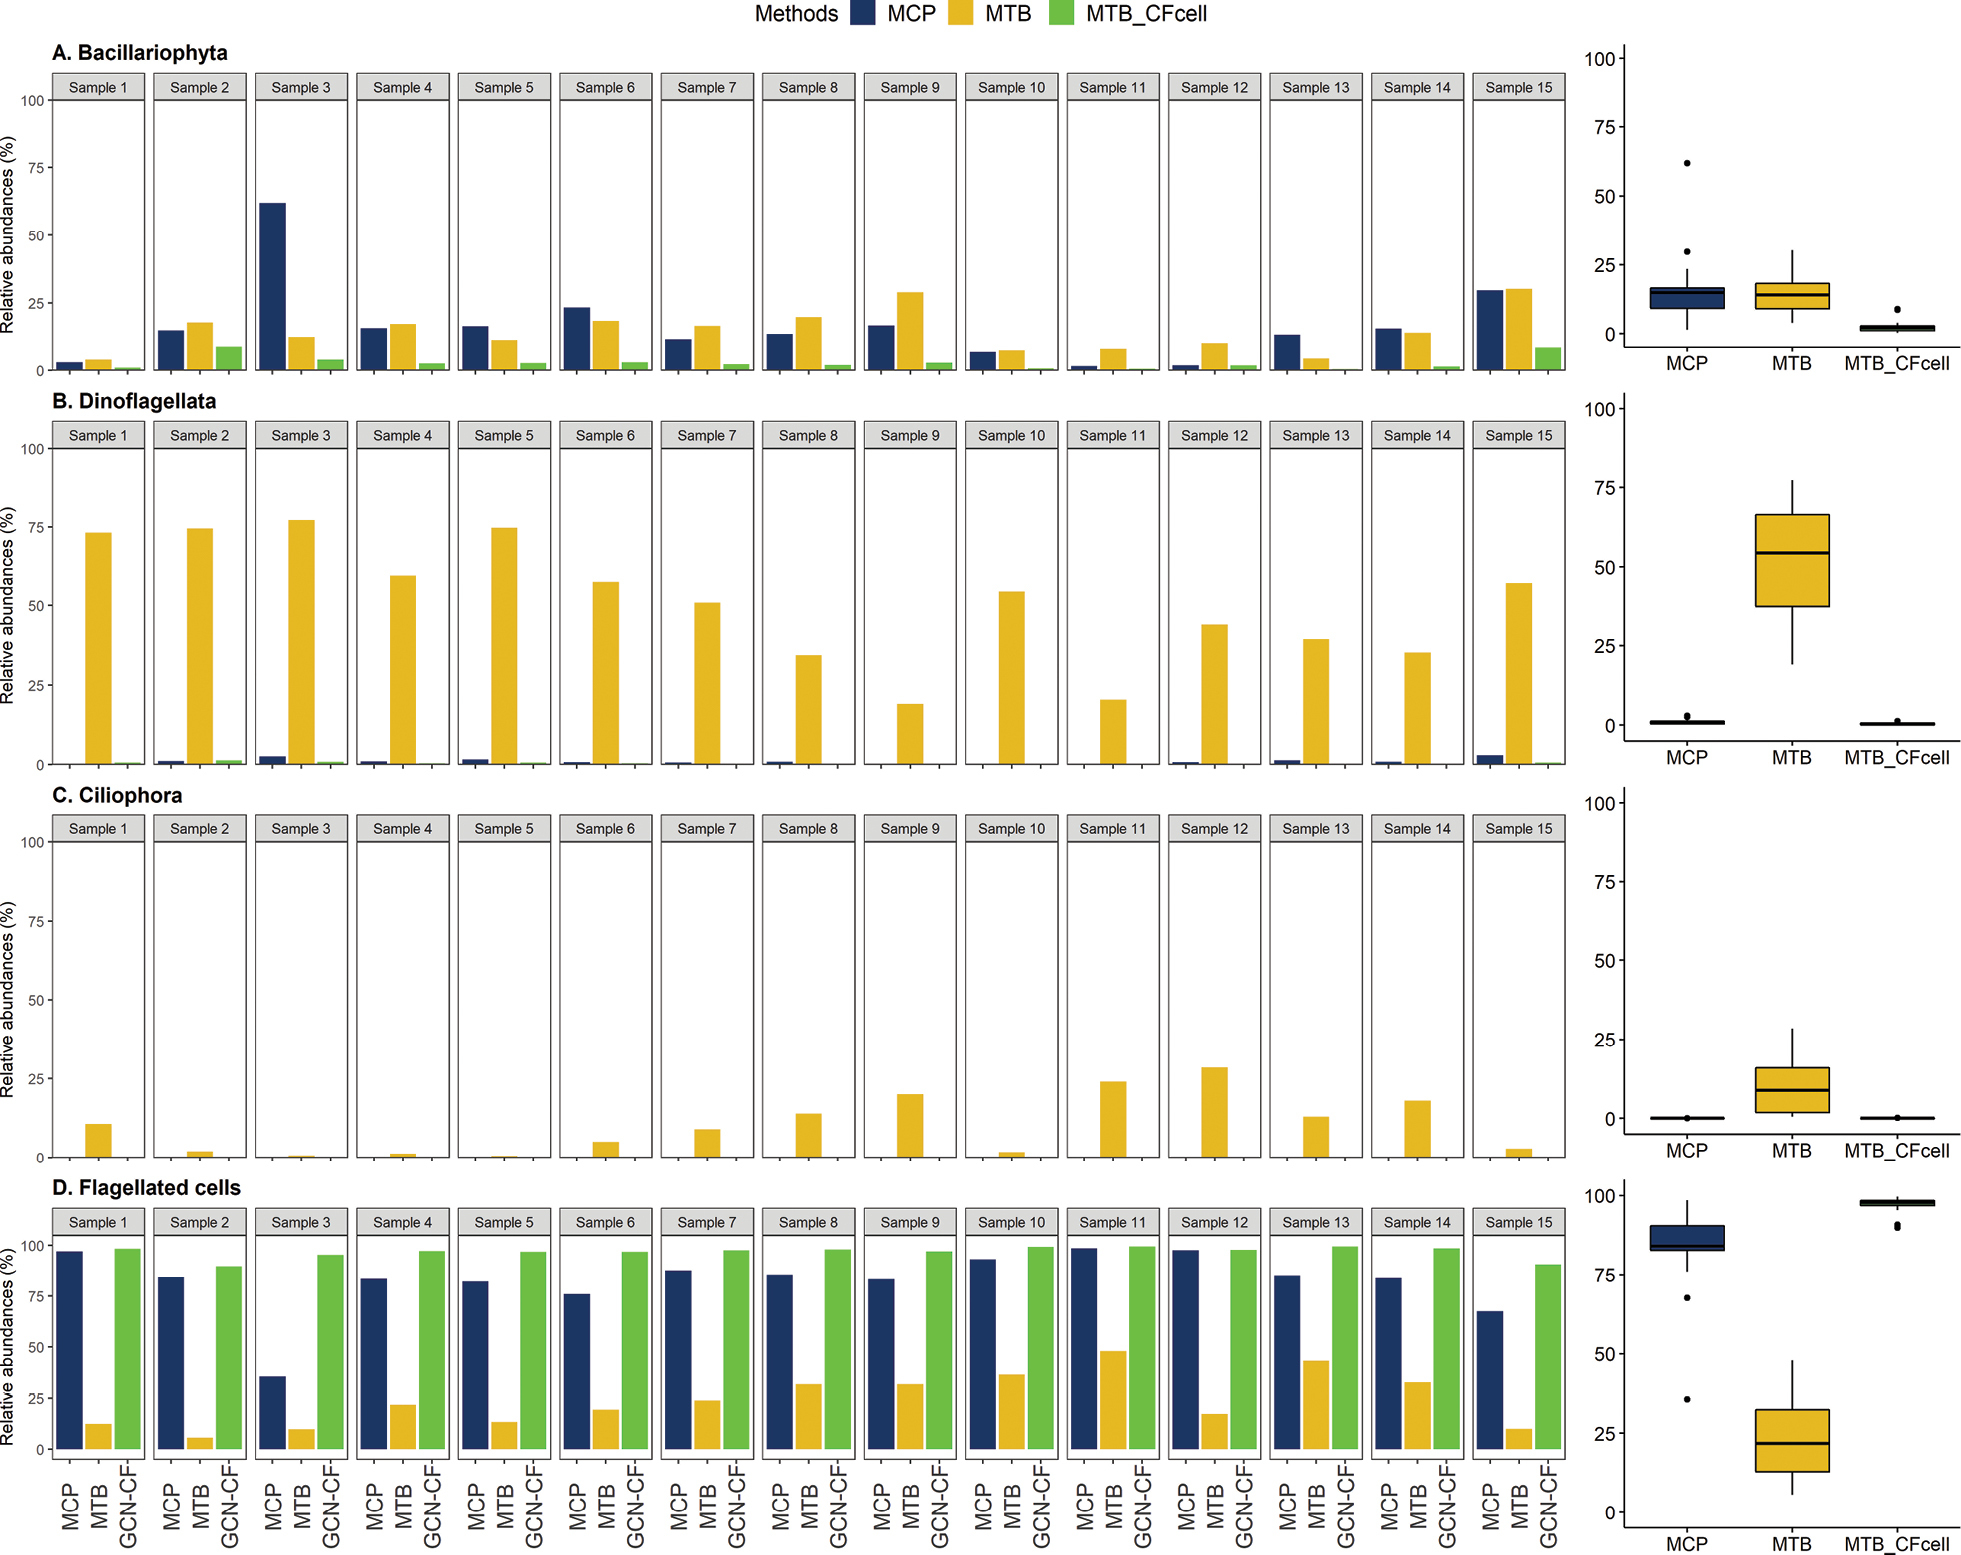
Comparison between relative abundances (%) of the cell counts from microscopy (MCP; blue), reads from DNA metabarcoding (MTB; yellow) and corrected read abundance percentages (MTB_CFcell; green) per sample. Right panels: box plots summarizing the comparison percentages of cell counts (MCP), metabarcoding reads abundance (MTB) and the corrected (MTB_CFcell) out of the 15 marine water samples per plankton group: (A) Bacillariophyta (Stramenopiles), (C) Dinoflagellata, (B) Ciliophora and (D) flagellated cells. The vertical line inside the box plots represents the median, the top and the bottom hinges correspond to the interquartile range, and the whiskers show the minimum and maximum non-outlier values. Note the scale difference between plankton groups. |