|
||
|
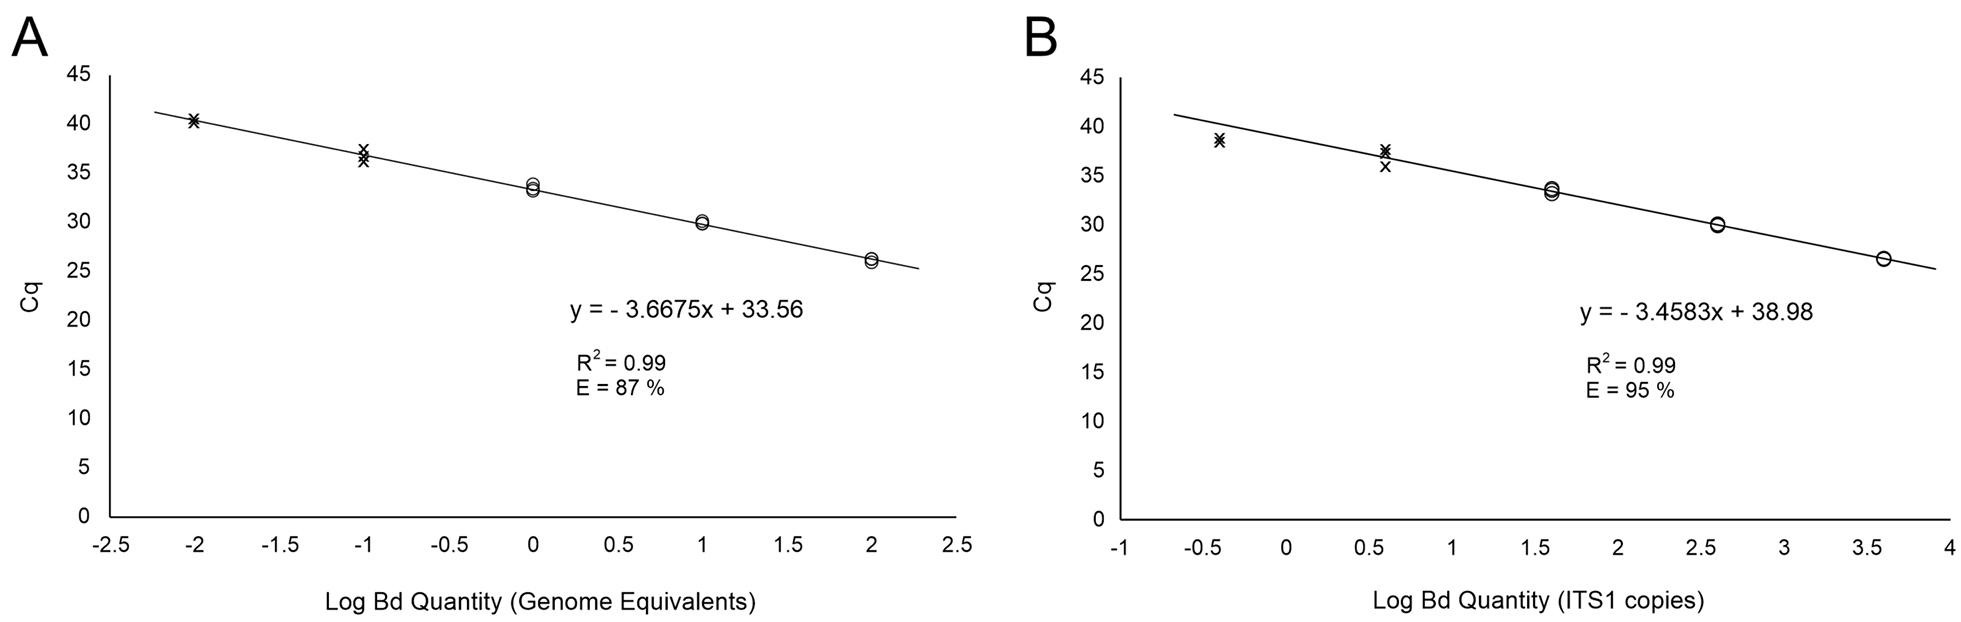
Examples of standard curves used to determine the limits of detection (LOD) and quantification (LOQ) for the Boyle TaqMan assay using spore DNA (providing genome equivalents) (A) and the synthetic gBlocks fragment Bd_27-271 (providing ITS copy numbers) (B) as standards. Crosses represent standard dilutions above the LOD but below the LOQ while circles represent standard dilutions used for determining the corresponding standard curves and their R2 and efficiency values (detailed on the panels). For the spore DNA curve (A), detailed statistics on multiple runs are provided in Suppl. material 3: Table S3. |