|
||
|
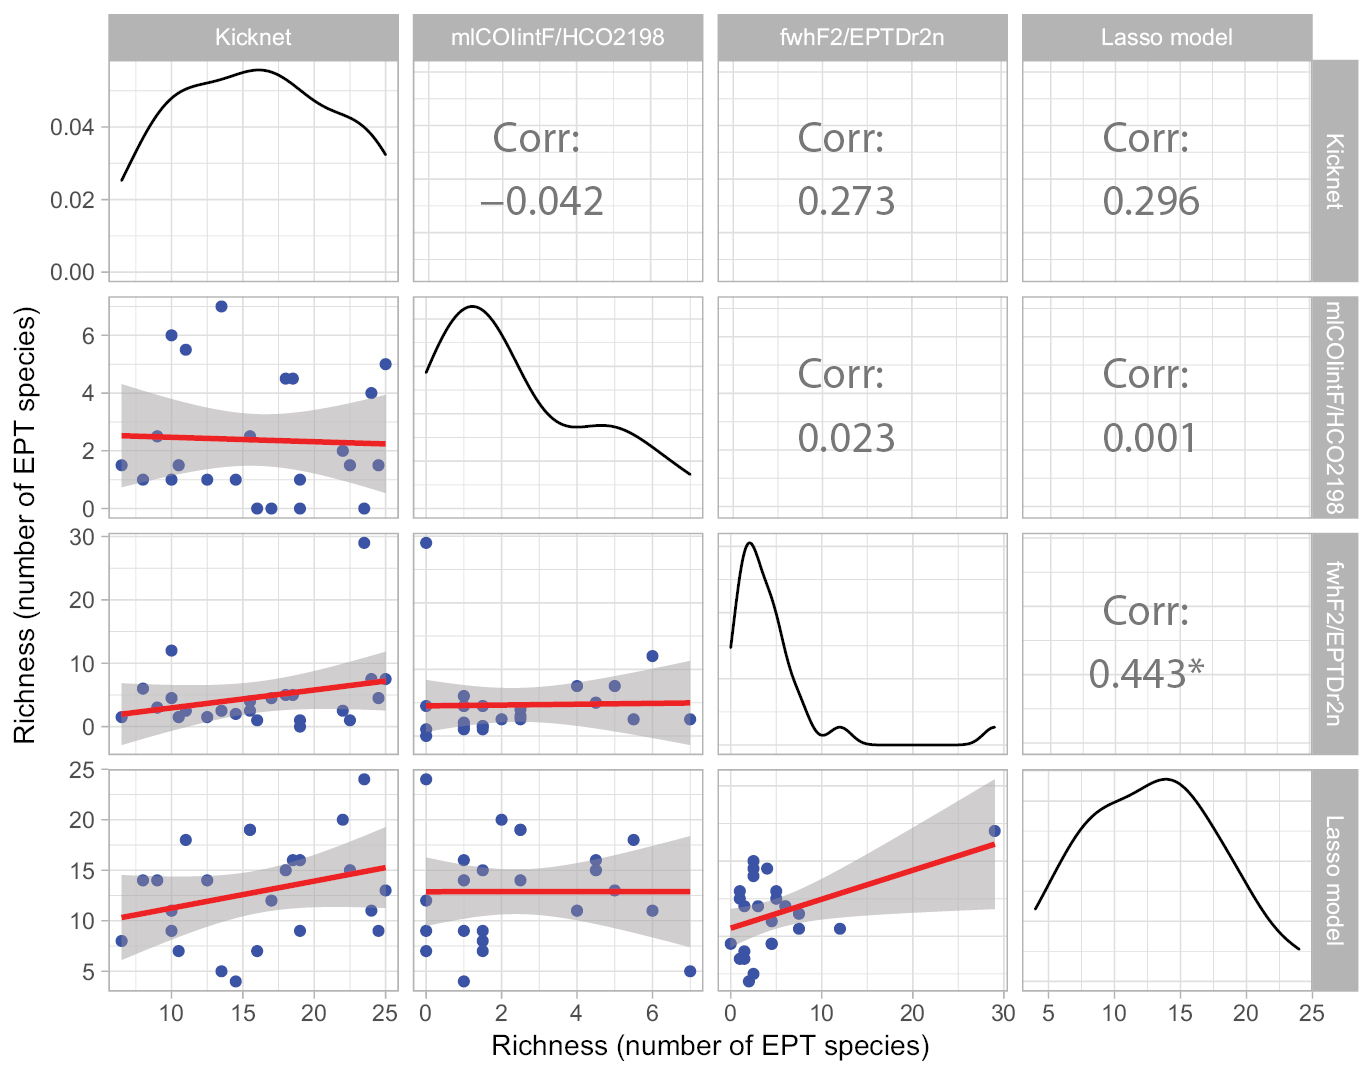
Relationships between the EPT richness estimates provided by the four investigated methods. The diagonal panels show the density estimate of EPT richness for each method. For each combination of methods, panels located in the lower triangle show the scatterplot of the EPT richness estimated by each method (x- and y-axis) with linear regression (red lines). Panels located in the upper triangle provides the Pearson correlation values between each method (asterisk indicates p-value < 0.05). |