|
||
|
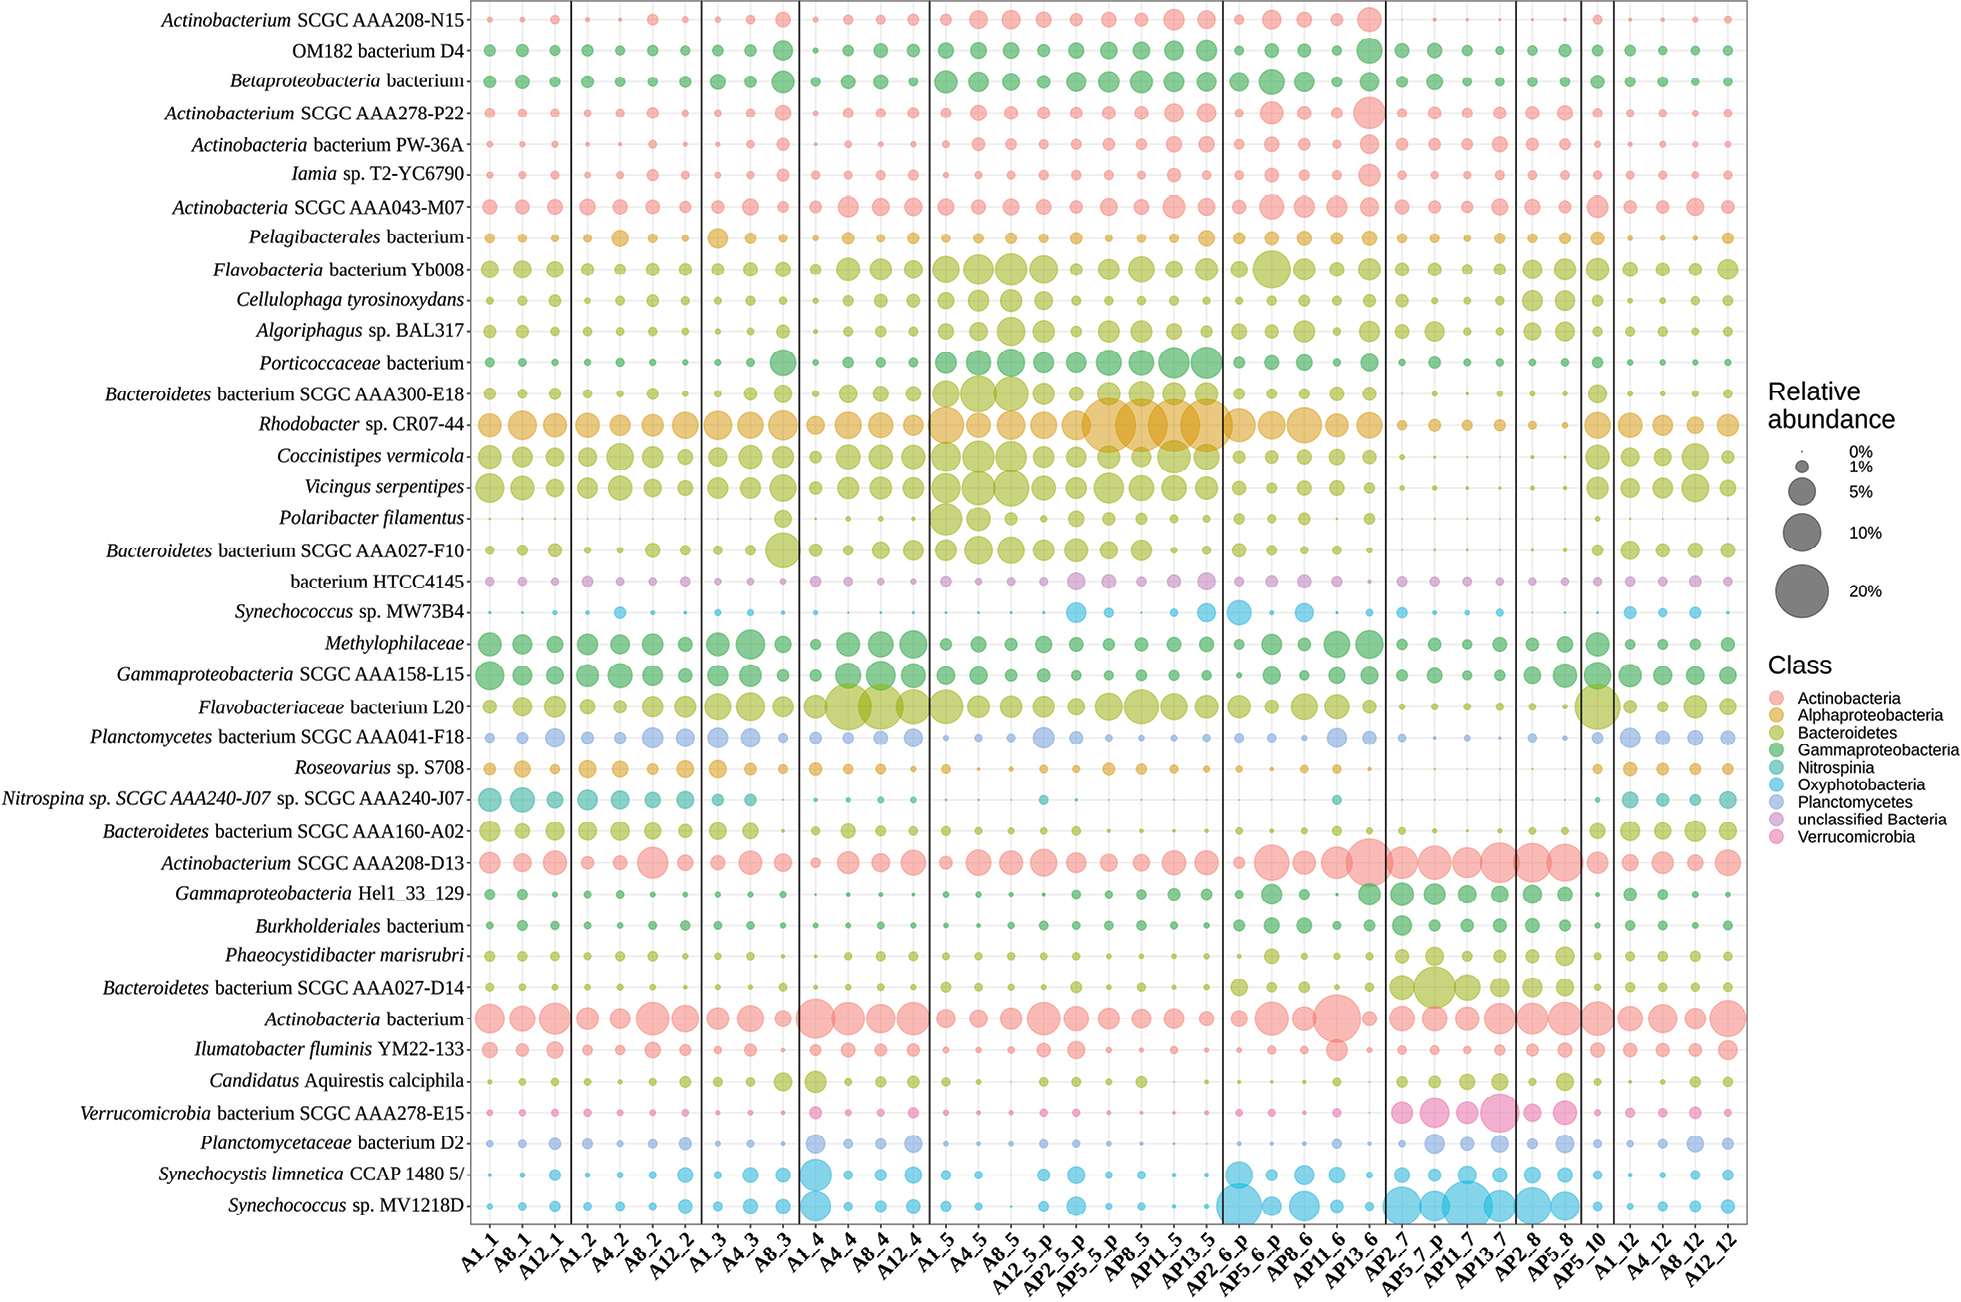
Relative abundances of bacteria-associated OTUs (TOP 39). The X-axis represents stations and sampling months, Y-axis displays selected taxa. Order of taxa is derived from pair-wise similarity matrix based on r-values (Pearson). Station and month labels marked with “_p” indicate months with pooled samples. Different colors indicate associations with different phyla. The size of the bubbles indicates relative sequence abundances. Vertical lines differentiate between the sampling months. |