|
||
|
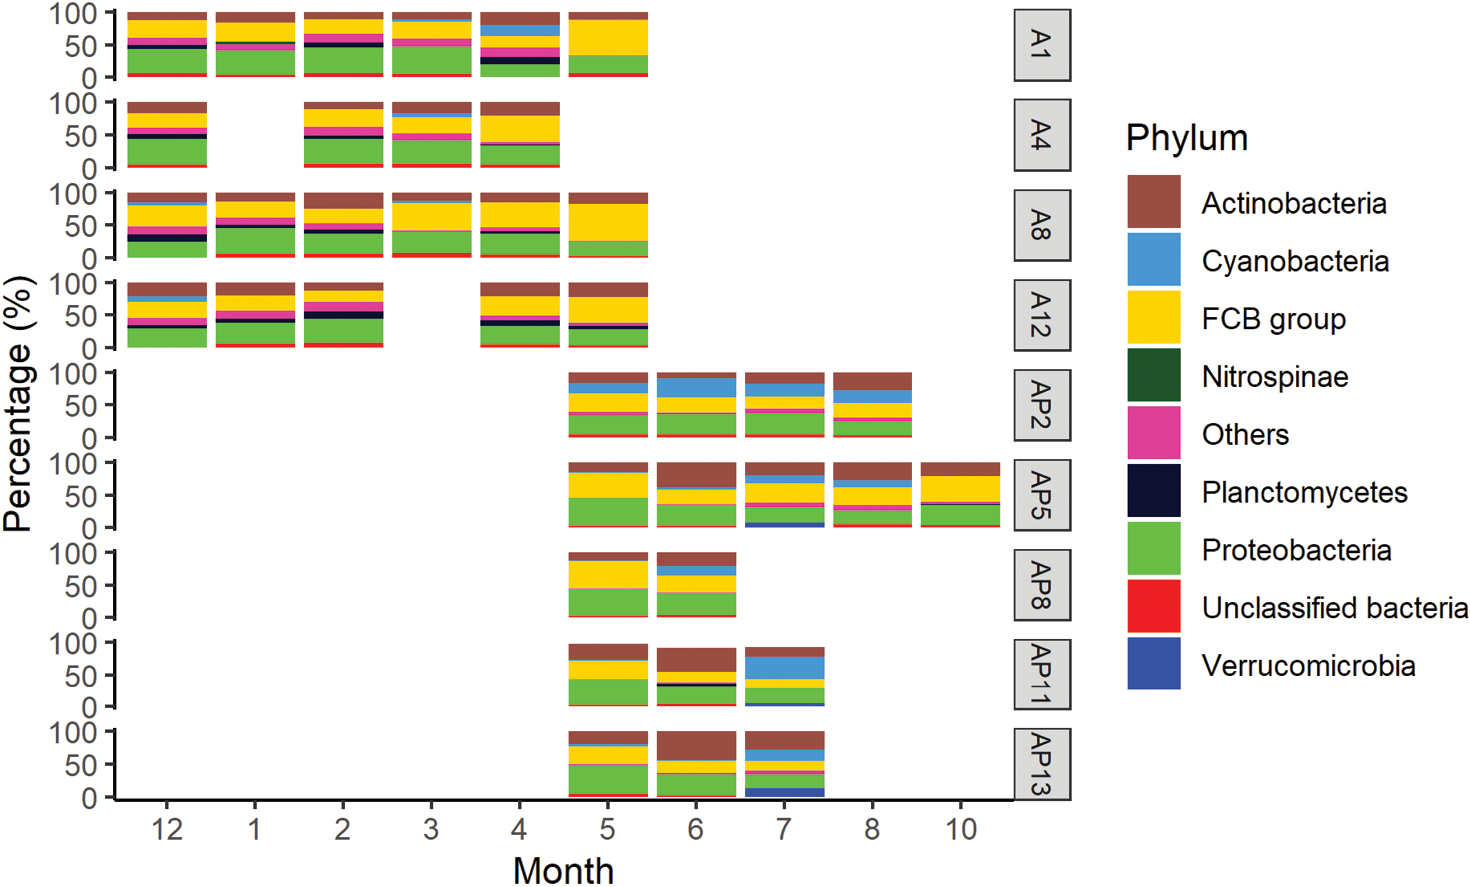
Relative sequence abundances of different phyla detected by 16S in different sampling months. TOP 5 most abundant phyla/groups are shown for each station and sampling occasion. (X-axis). Y-axis displays the relative sequence abundances for each phyla/group. Sequences belonging to the phyla/group that did not belong to the TOP 5 phyla/group for the particular sampling occasion are displayed as “Others”. |