|
||
|
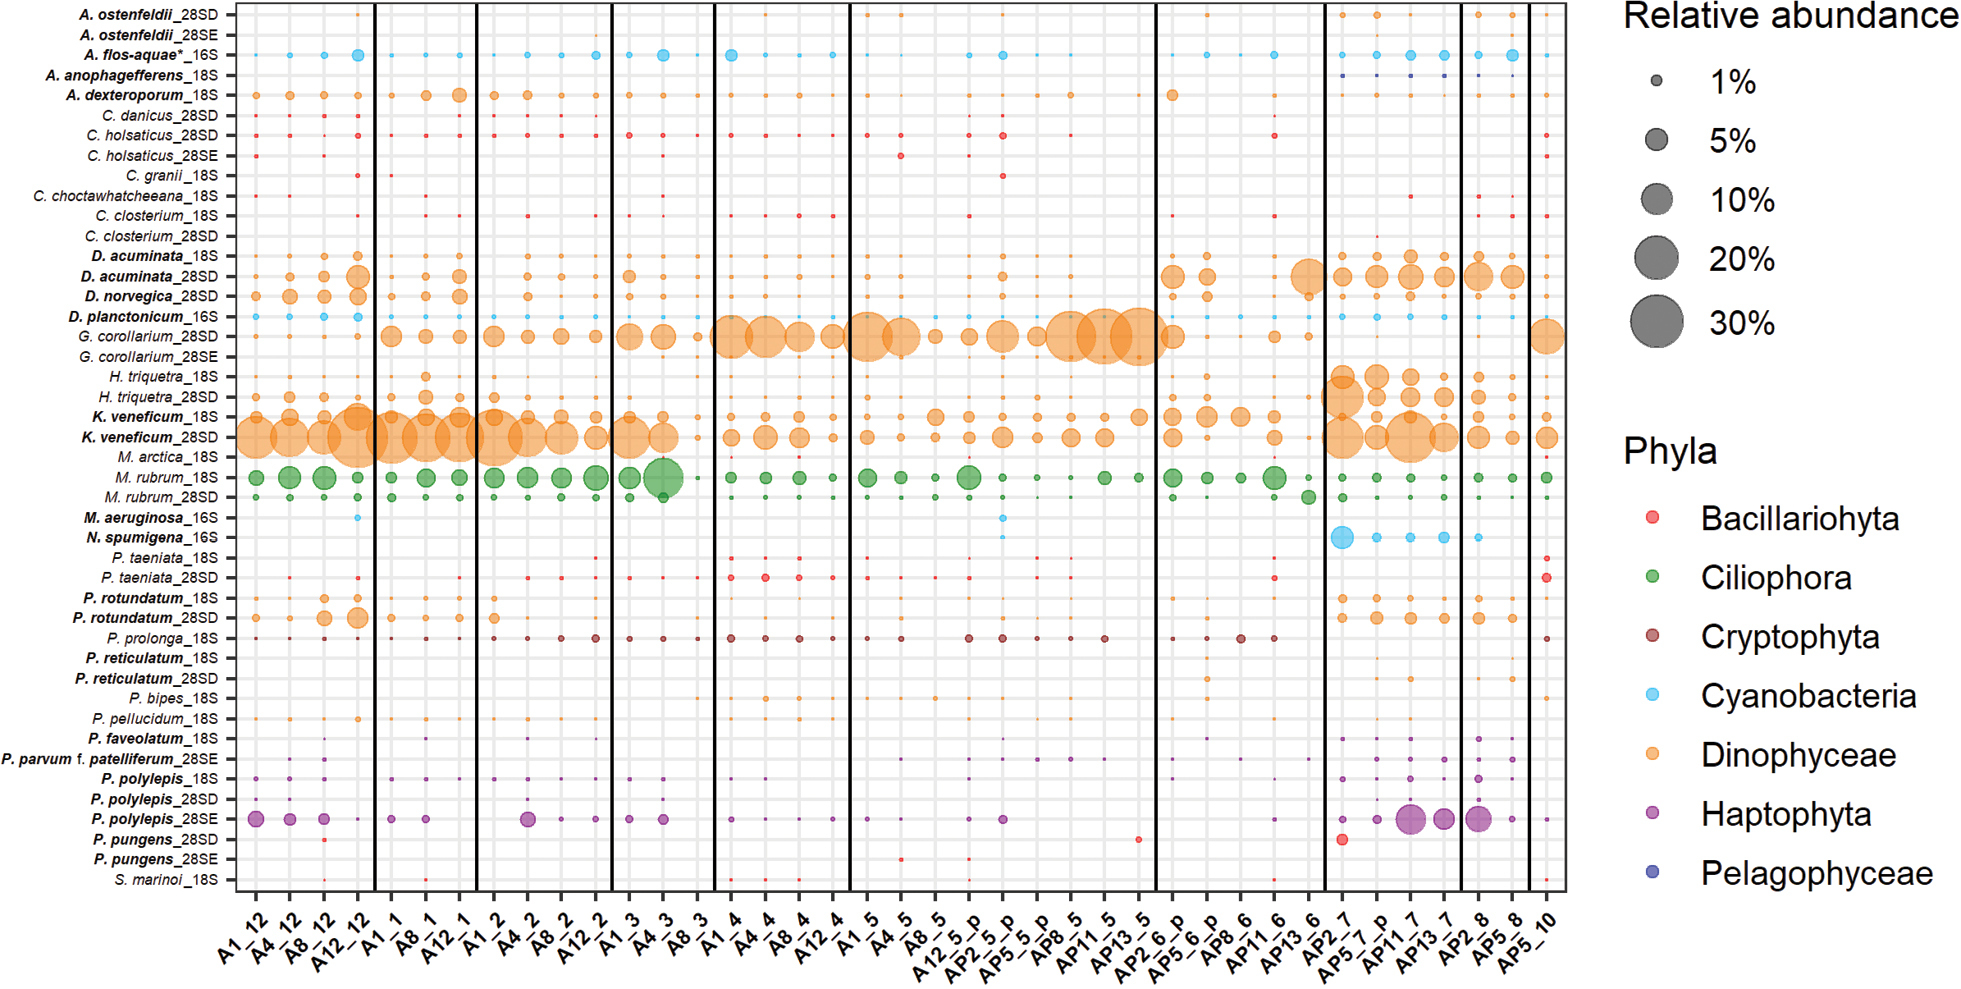
Relative sequence abundances of common/dominant/toxin-producing species detected based on different markers. The X-axis represents stations and sampling months, Y-axis displays species detected. Species marked with bold are known to produce toxins (Moestrup, et al. 2020). Station and month labels marked with “_p” indicate months with pooled samples. Different colors indicate associations with different phyla. The size of the bubbles indicates relative sequence abundances. Vertical lines differentiate between the sampling months. *no toxicity confirmed from the Baltic Sea (Sivonen et al. 1989; Šulčius et al. 2015) |