|
||
|
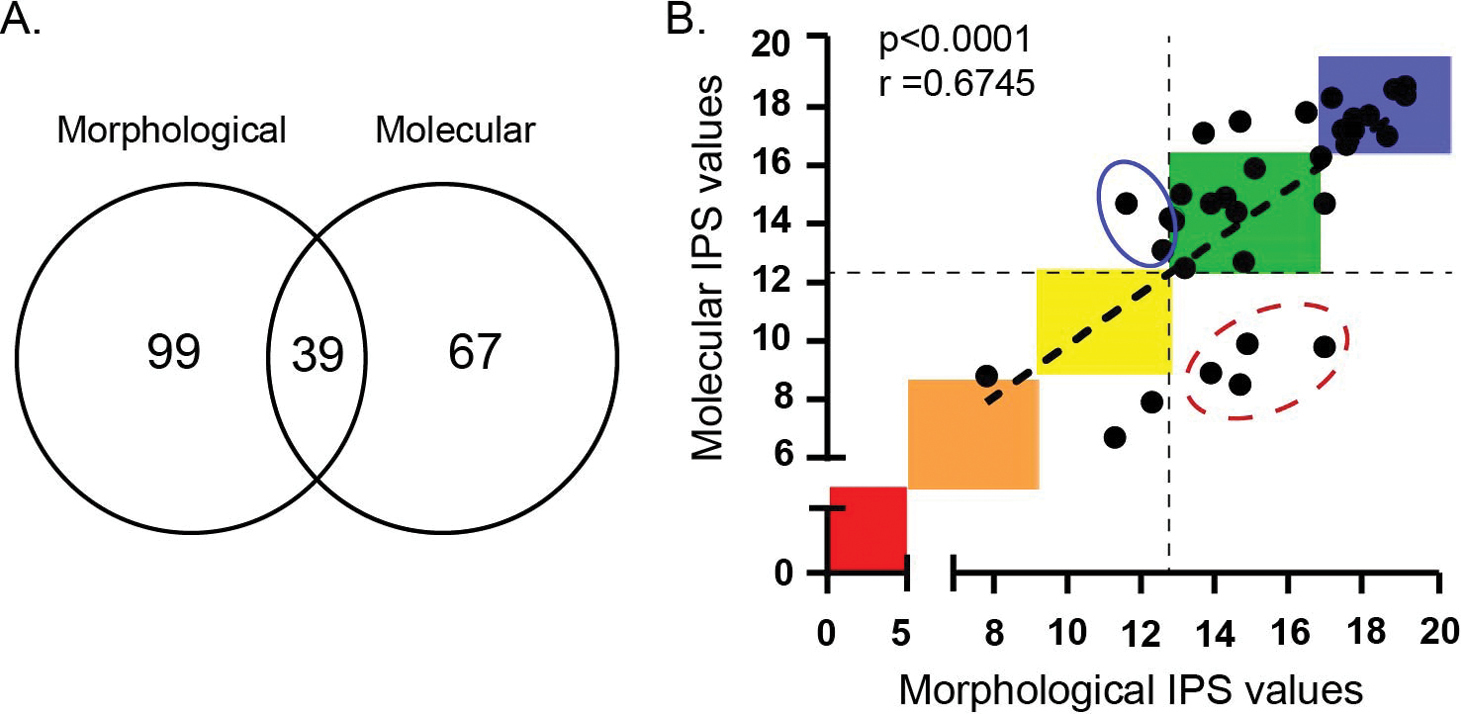
Comparison of morpho-taxonomic and molecular identification at the species level. A) Venn Diagram demonstrating the number of species identified by both methodologies, by morpho-taxonomic identification only (99), by molecular identification only (67) and by both methods (39). Suppl. material 1: Table S1 gives the number of valves and number of reads recorded for the 39 common species; B) IPS correlation of the morpho-taxonomic and molecular identification methodologies. Pearson Correlation was performed indicating a significant correlation (r = 0.6745, p < 0.0001. The boundaries of the ecological status classes are marked: red (Bad), orange (Poor), yellow (Moderate), green (Good), blue (High). Dashed lines: Good/moderate boundary, Red dashed circle: morphological classifies as good status, while molecular classifies below good status. Blue cirlce: morphological classifies as below good status, while molecular classifies good status. |