|
||
|
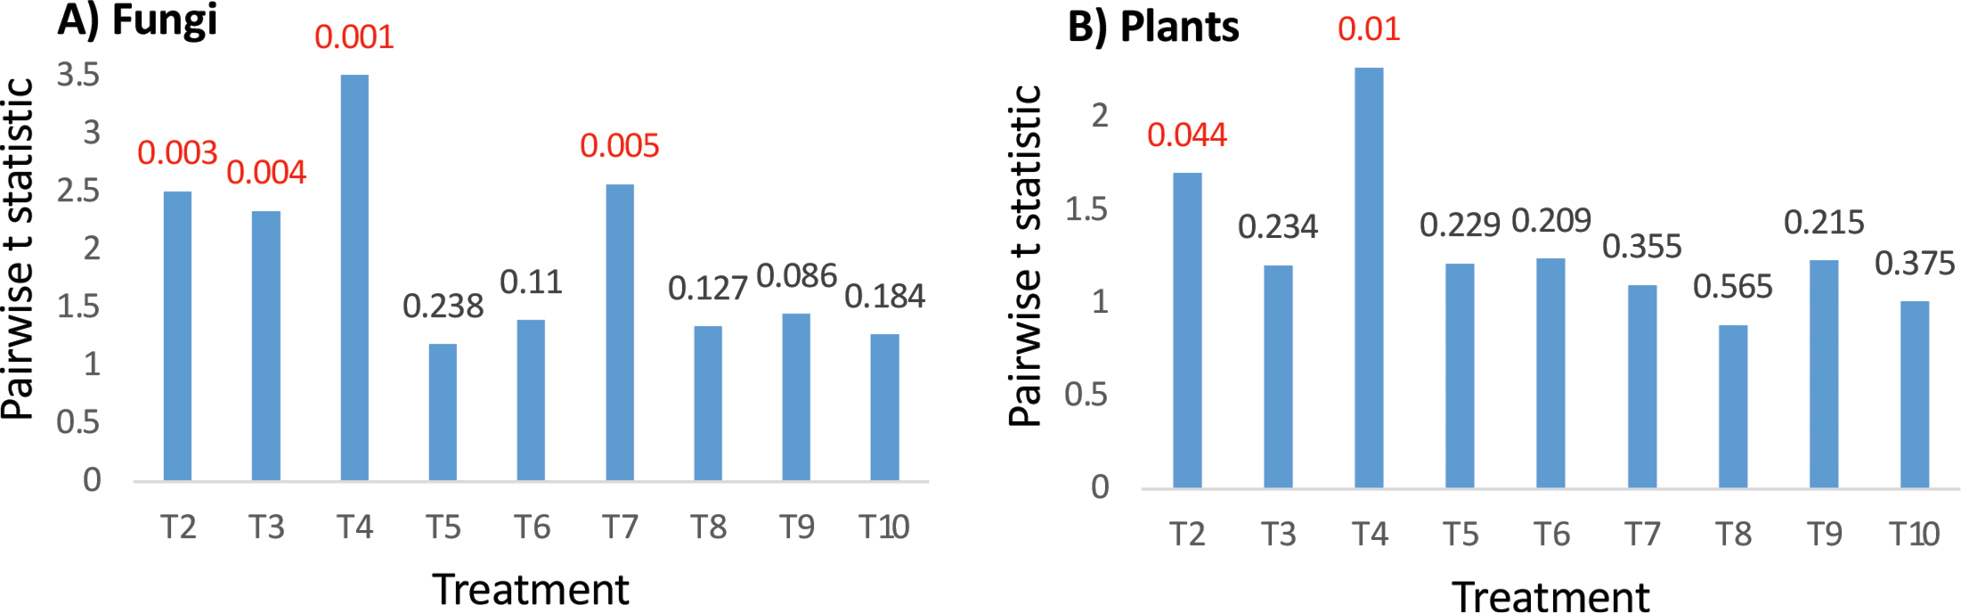
Levels of t-statistic from pairwise Permanova of the control treatment compared to all other treatments (n = 4). The p value is shown above the bar with significant (P < 0.05) values shown in red. (A) fungal community data (B) plant community data. |
|
||||||||
| Part of: Clasen LA, Detheridge AP, Scullion J, Griffith GW (2020) Soil stabilisation for DNA metabarcoding of plants and fungi. Implications for sampling at remote locations or via third-parties. Metabarcoding and Metagenomics 4: e58365. https://doi.org/10.3897/mbmg.4.58365 |