|
||
|
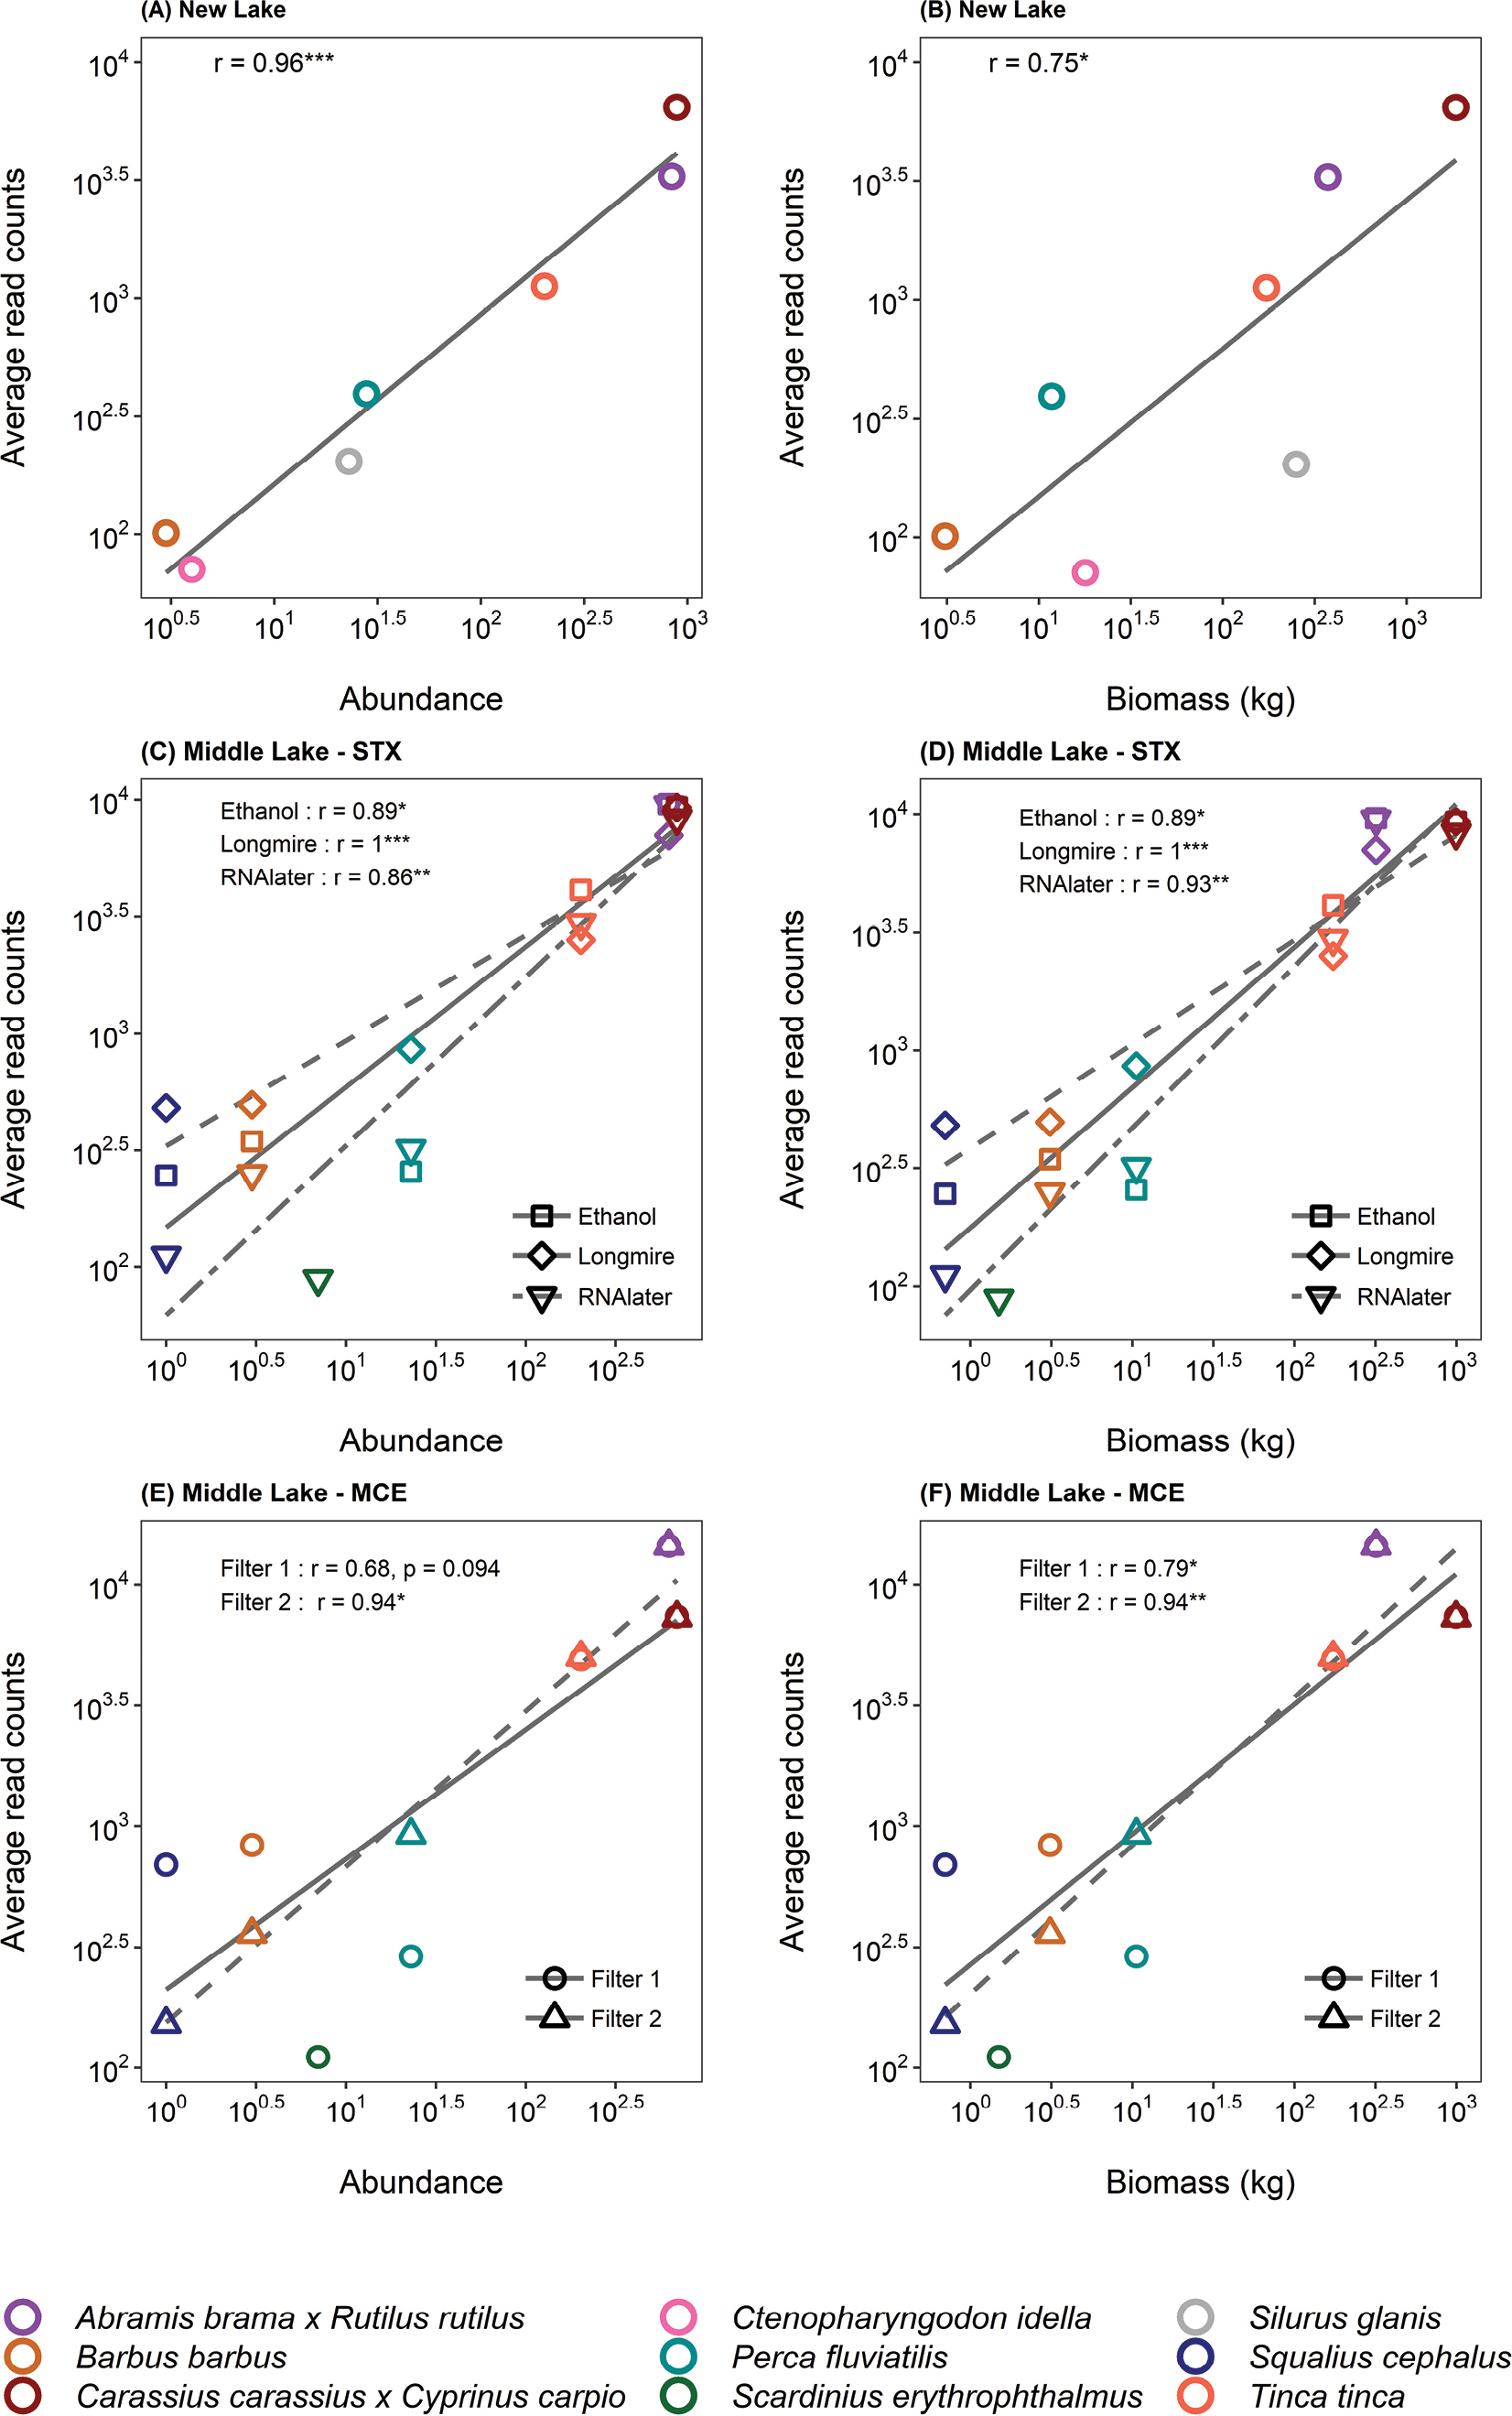
Correlations between eDNA metabarcoding read counts and fish abundance/biomass. Scatterplots showing lines of best fit and Spearman’s correlations of fish species average read counts with abundance (number of individuals, on the left) and biomass (kg; on the right) at different sampling occasions. Panel (A) and (B) Spearman’s correlations for New Lake; (C) and (D) Spearman’s correlations for Middle Lake with Sterivex filters (STX); (E) and (F) Spearman’s correlations for Middle Lake with open filter membranes (MCE). Plot axes were log transformed for better visualization. Significance codes: ***0.001; **0.01; *0.05. |