|
||
|
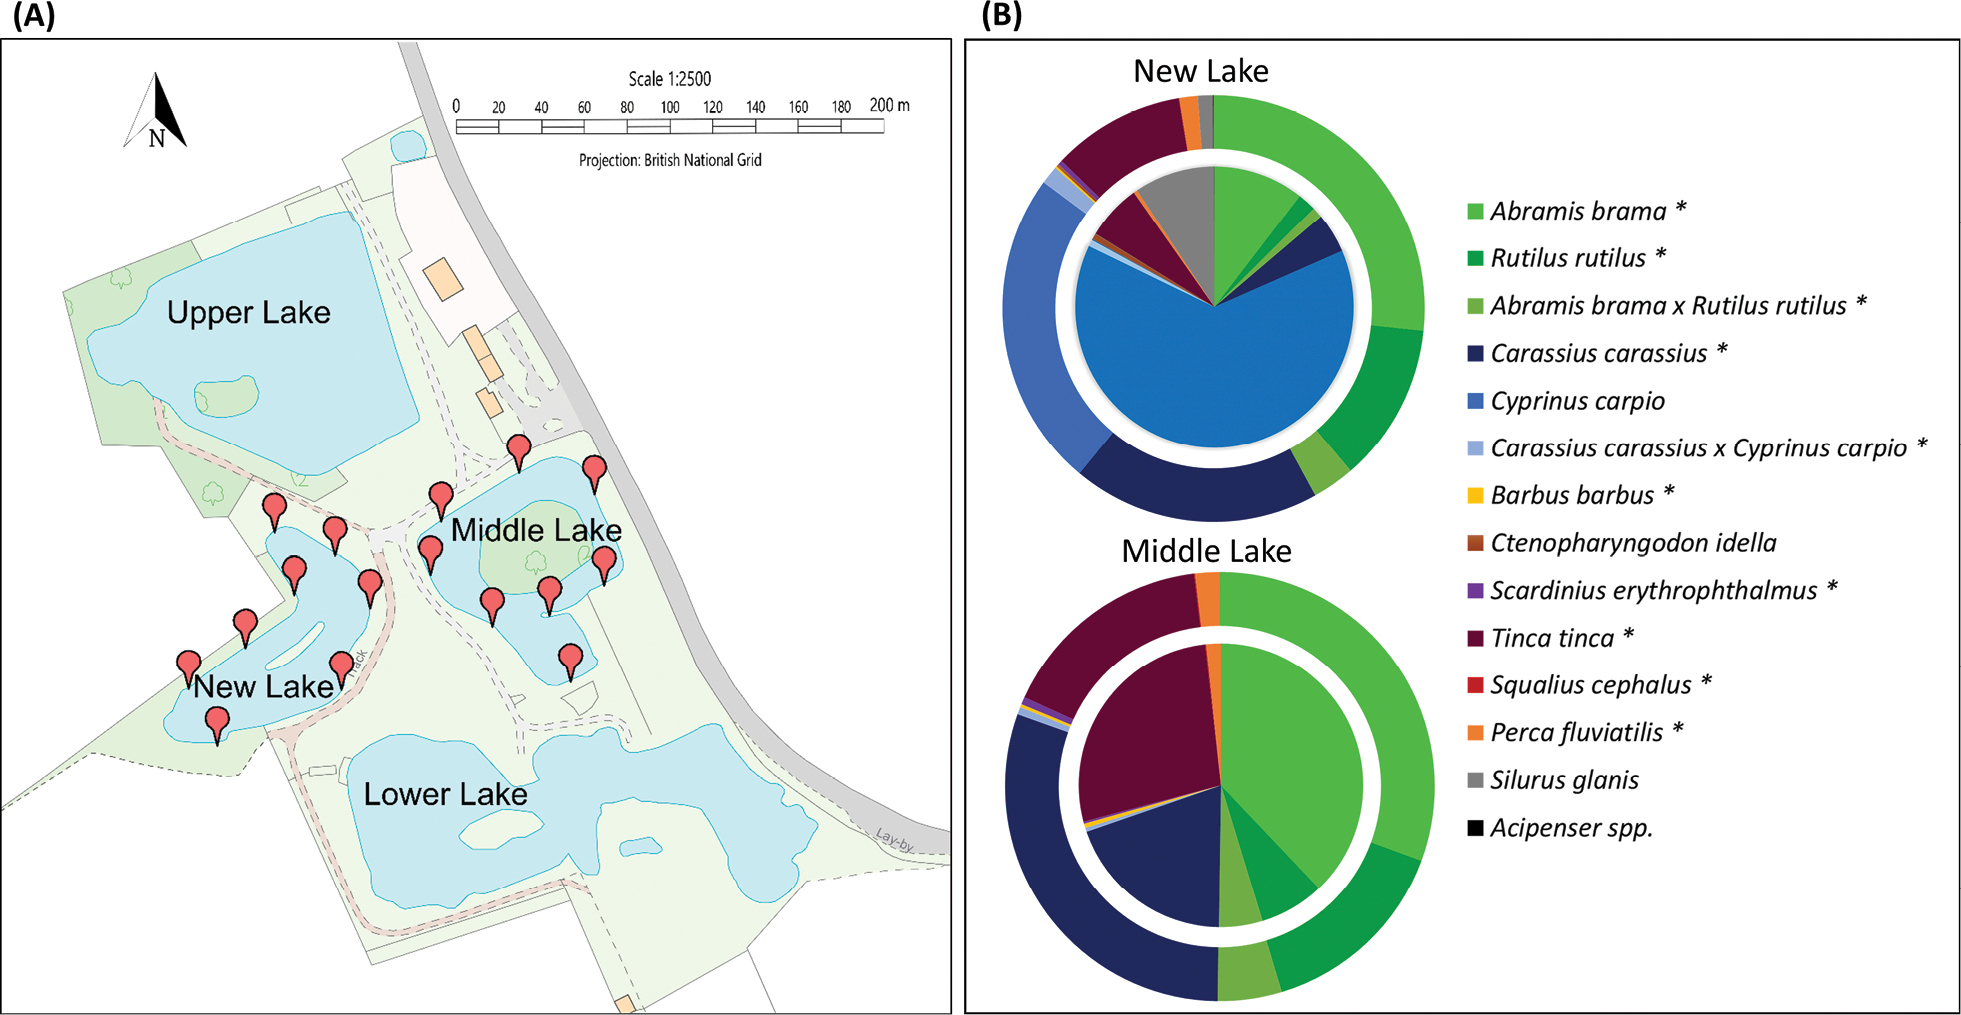
Map and fish diversity of the site surveyed. (A) Map of eDNA collection sites (in red) at the fishery venue. Map was downloaded and edited from Digimap (https://digimap.edina.ac.uk). (B) Fish species composition of the New Lake and Middle Lake after re-stocking (species with asterisk only). Ring pie charts (outer circles) show proportion of species composition by fish abundance (number of individuals); pie charts (inside circles) indicate proportion of species composition by fish biomass (kg). |