|
||
|
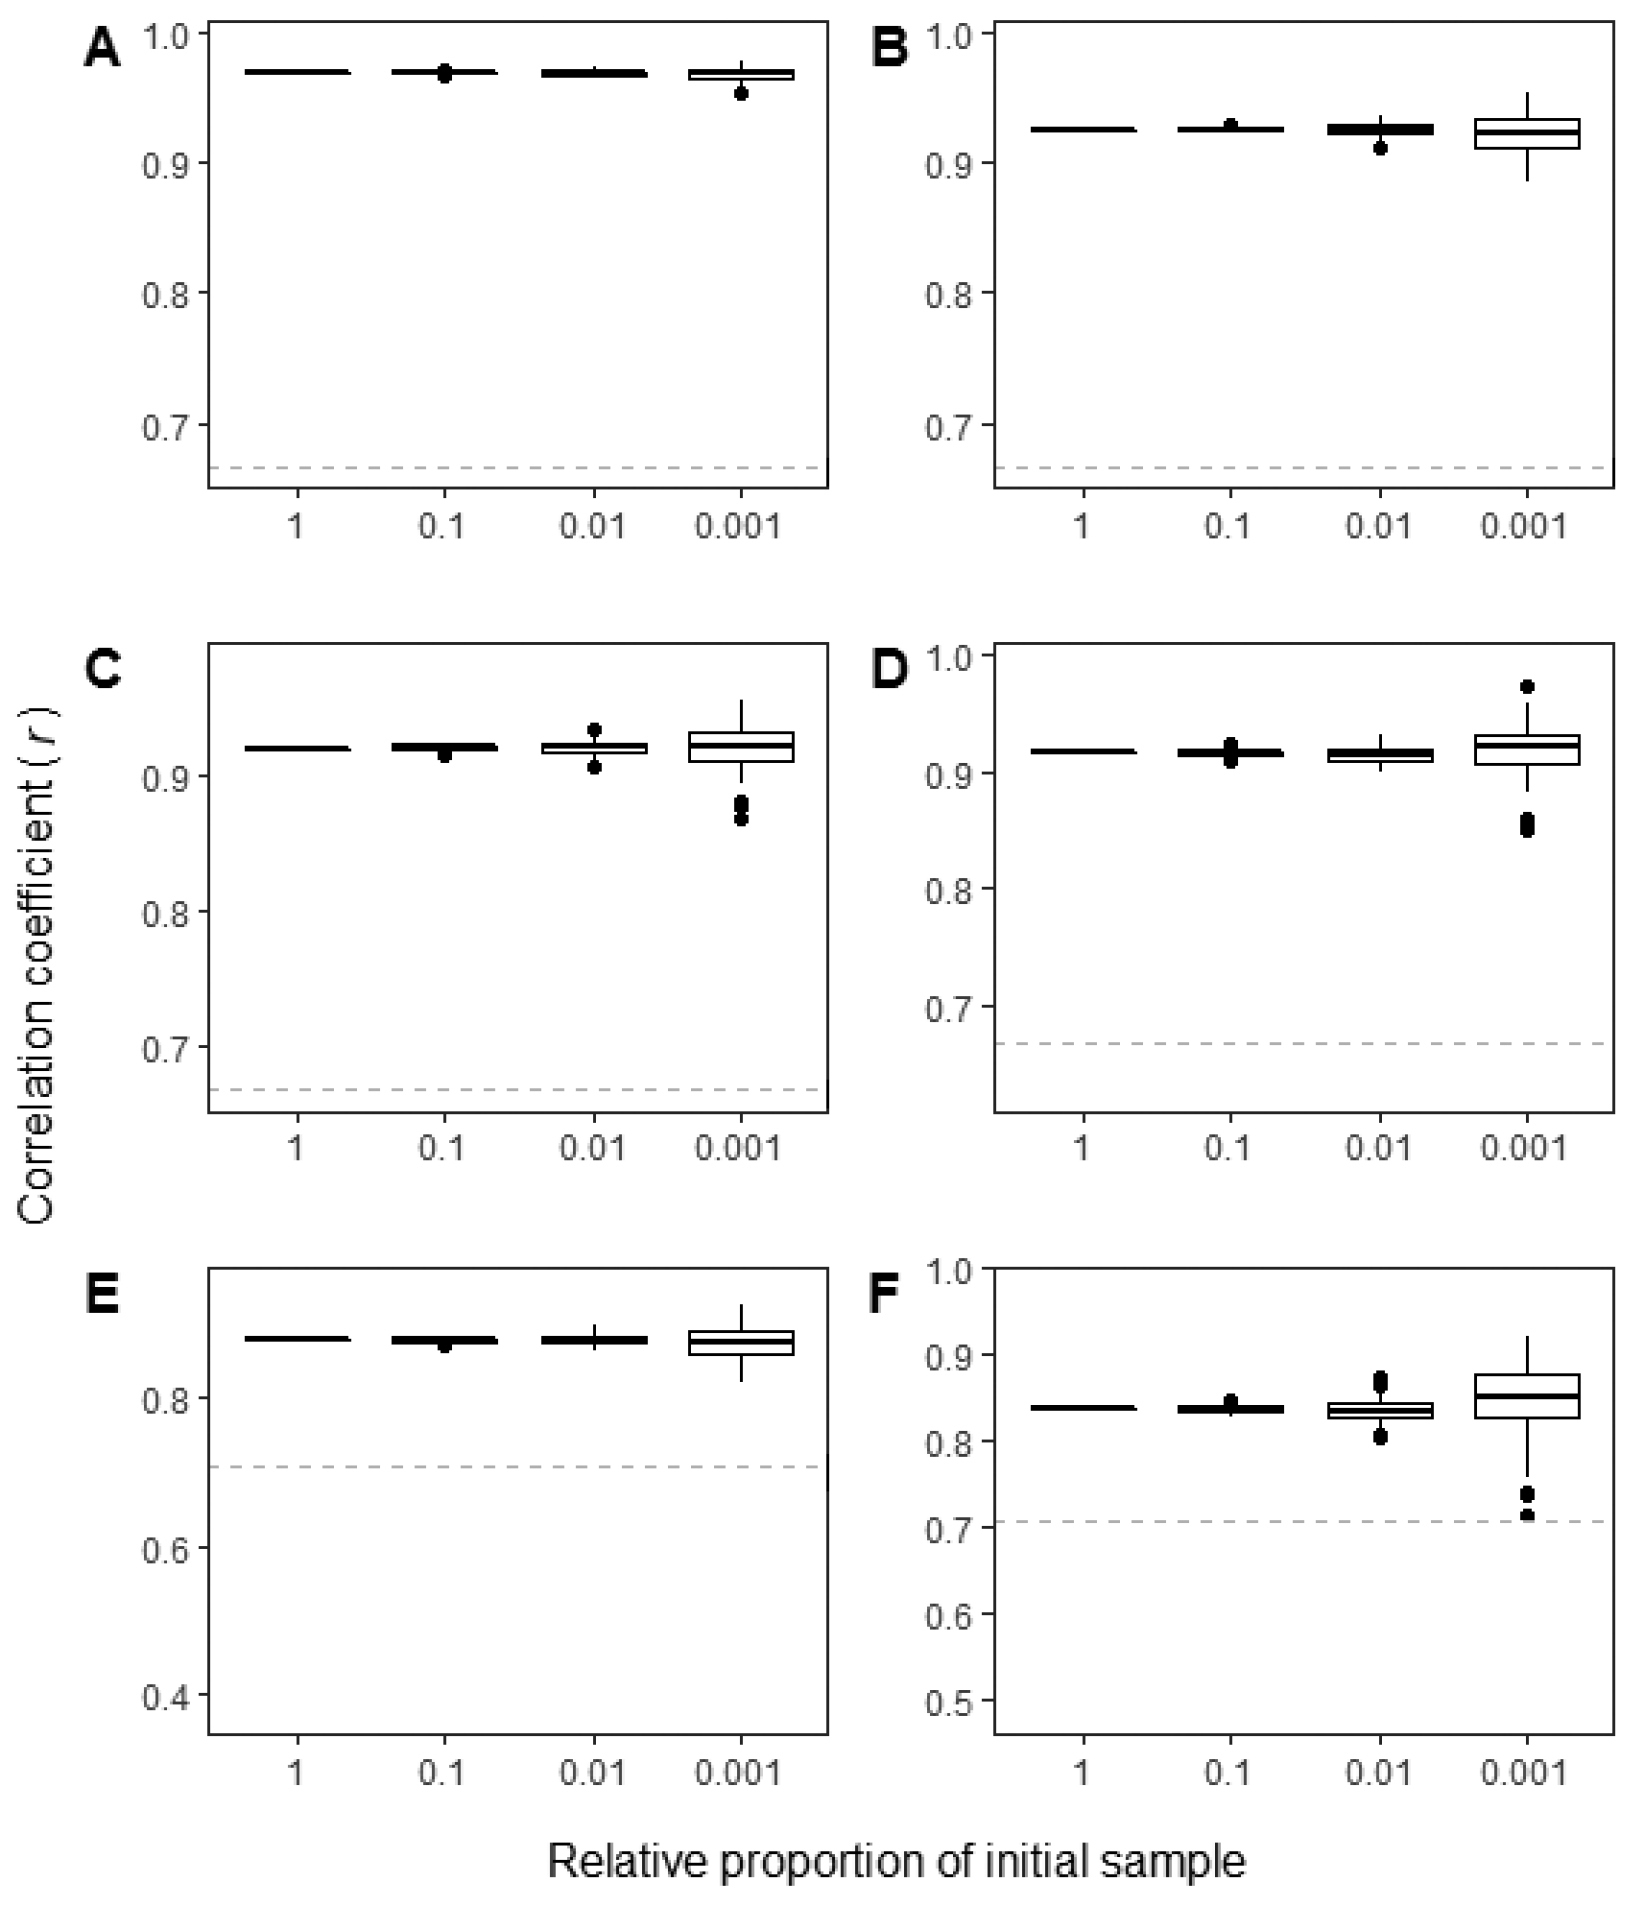
Effect of the rarefaction of reads on the correlation coefficient r between the expected and the recovered relative abundance of the species in the six mixed-species libraries (A to F correspond to libraries 1 to 6). The x axis indicates the proportion of reads used (when 1, all reads were used, so there is only one value); in the rest of the values, 100 random repetitions were conducted using the indicated proportion of reads. The horizontal dashed line of each plot indicates the critical value of r, above which measured r is statistically significant at p < 0.05. |