|
||
|
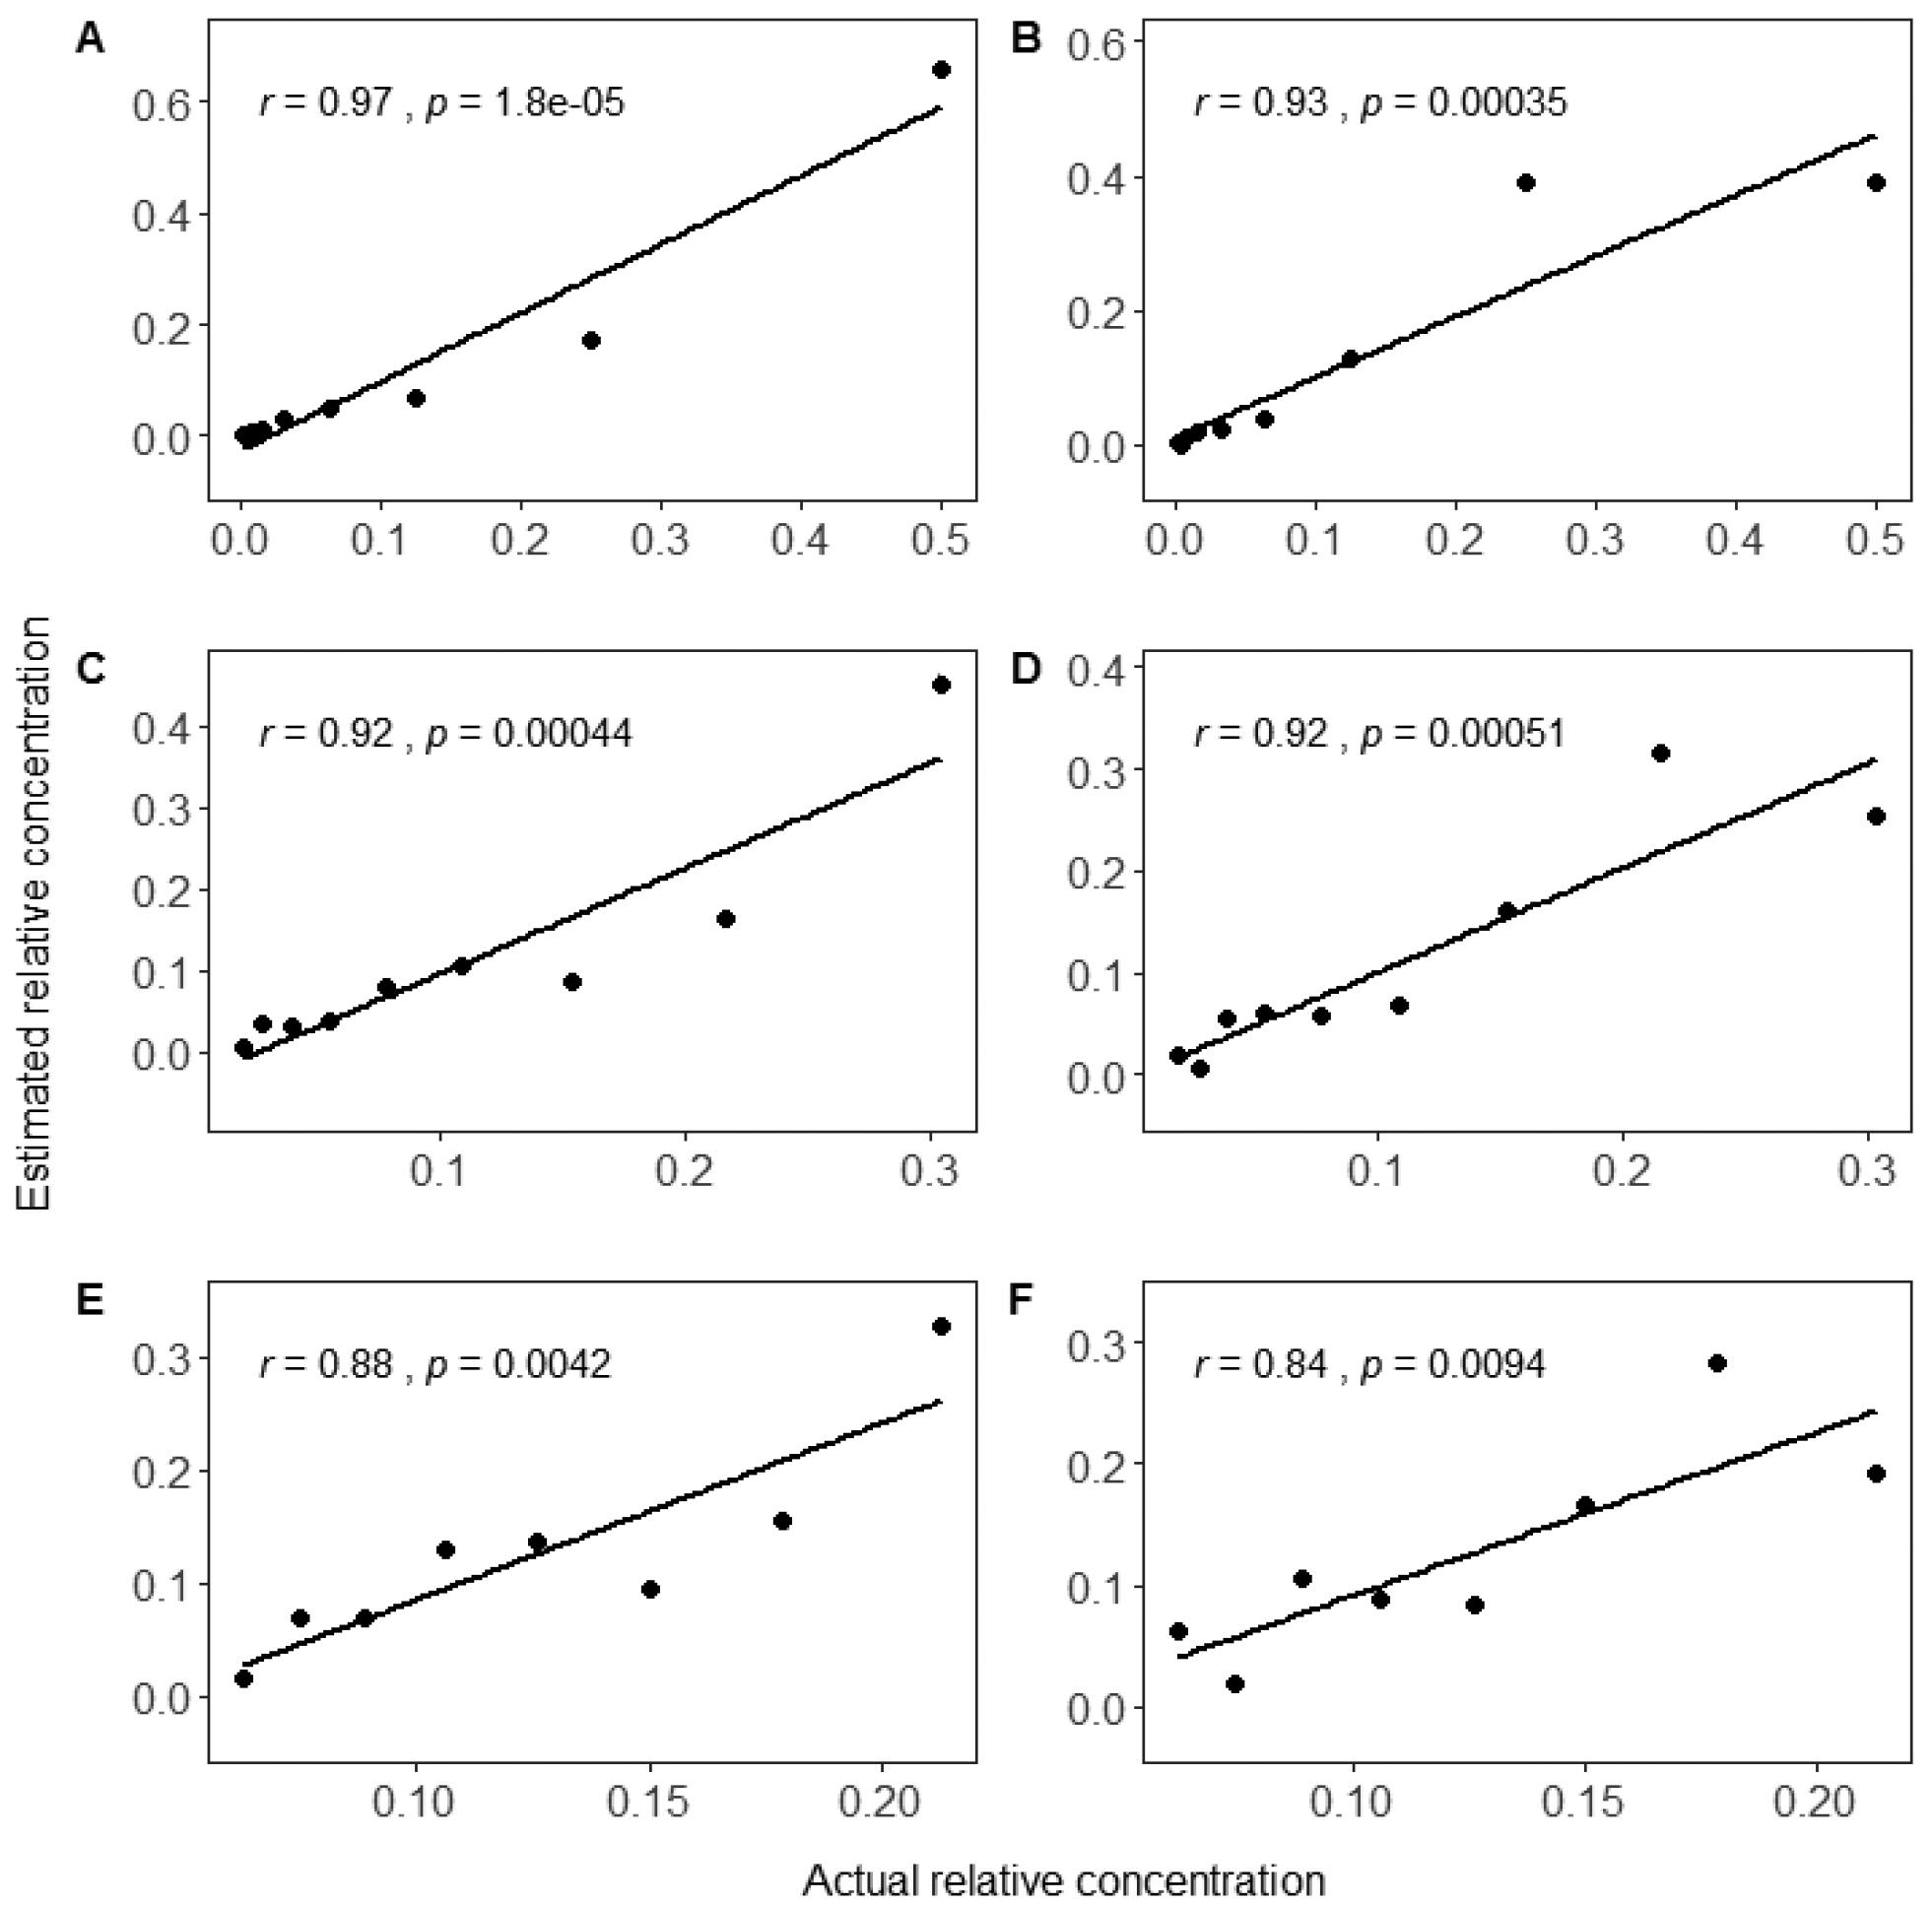
Scatter plots between the expected (i.e. as the mixtures were prepared in the lab; Table 2) and the estimated species relative abundance following the described bioinformatic pipeline (Table 4). Each plot corresponds to one mixed-species library (A to F corresponds to libraries 1 to 6). Each point in the plot indicates one species in the mixture. In each plot, the correlation coefficient (r) and its p-value are also indicated. |