|
||
|
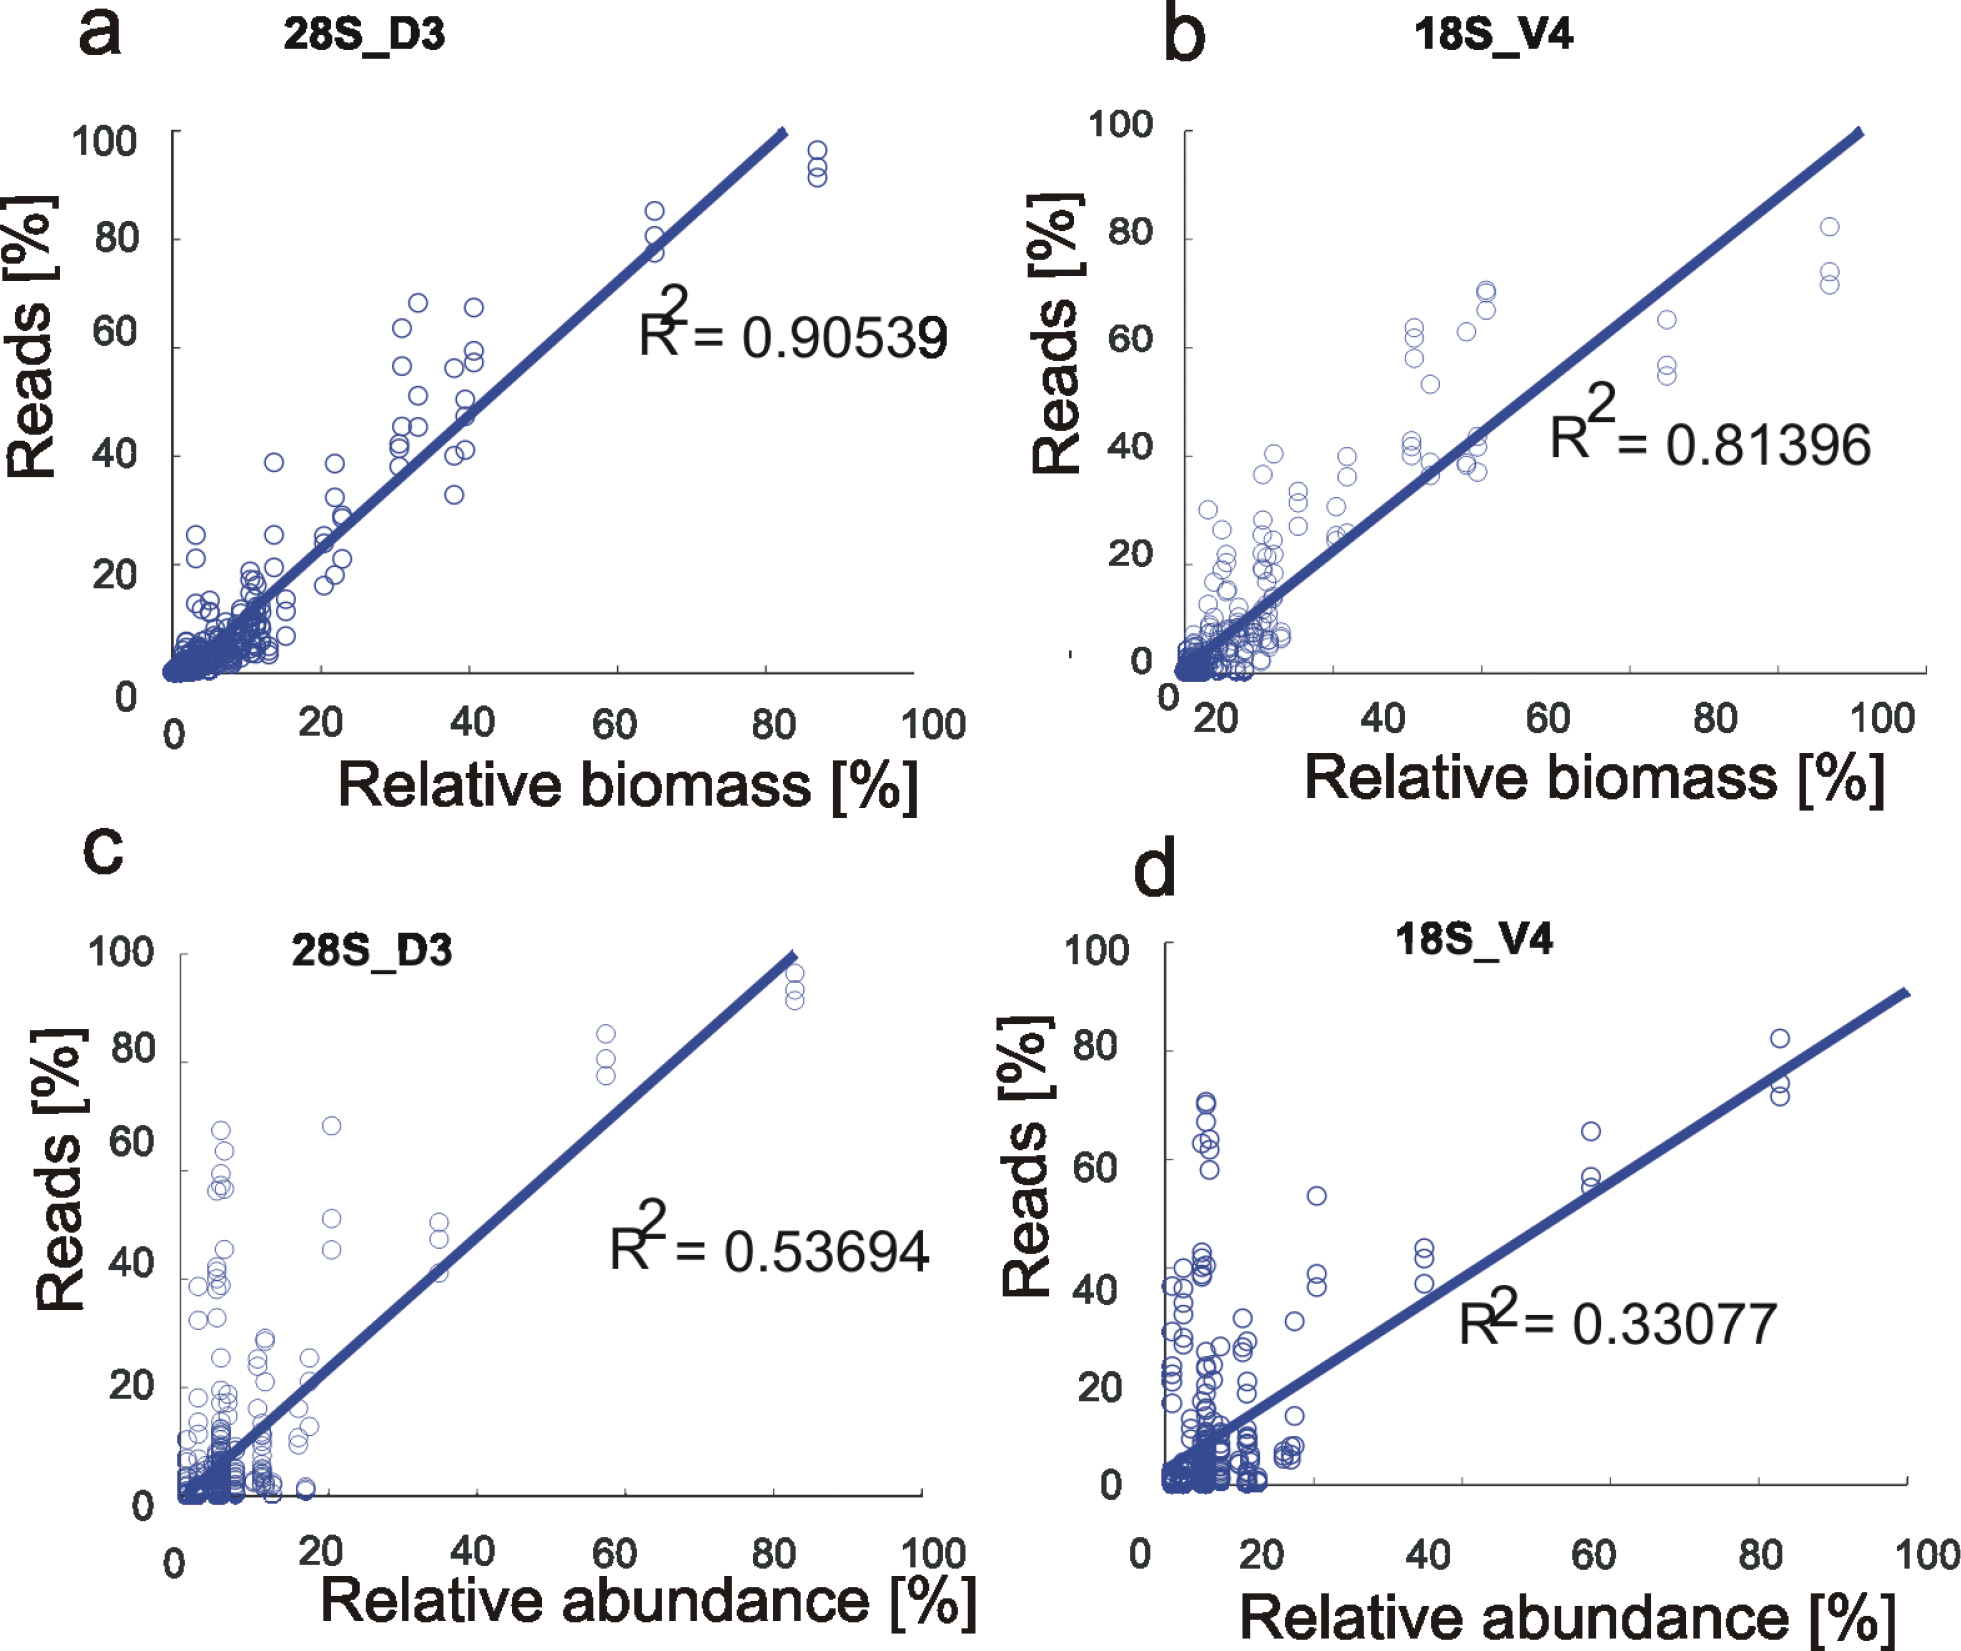
Correlations of relative biomass and relative abundance against relative read proportions. a–b Correlation of 239 relative biomass proportions in μg (x-axis) against the relative number of generated reads (y-axis). Given is the slope of the 240 correlation and the according R2-value for the 28S_D3 and the 18S_V4 marker. c–d Correlation of relative abundance 241 proportions in μg (x-axis) against the relative number of generated reads (y-axis). Given is the slope of the correlation and 242 the according R2-value for the 28S_D3 and the 18S_V4 marker. 24 |