|
||
|
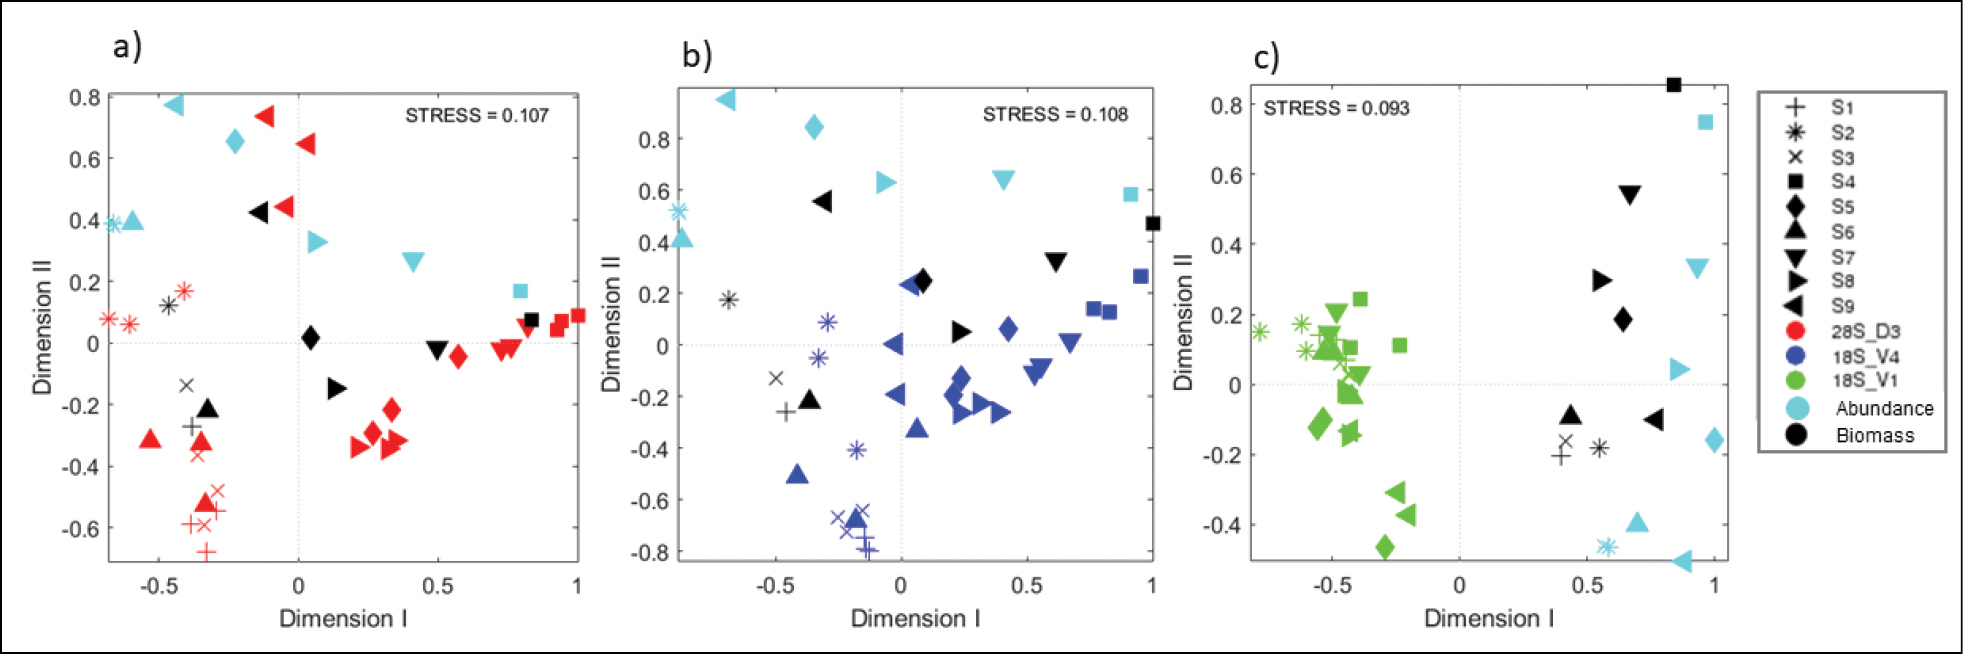
NMDS plots for a) the 28S_D3 region, b) the 18S_V4 region and c) the 19S_V1 region depicting the 9 samples. Each sample is shown with three replicates, together with the relative proportion of biomass (black) and the relative abundance of the original community (cyan). |