|
||
|
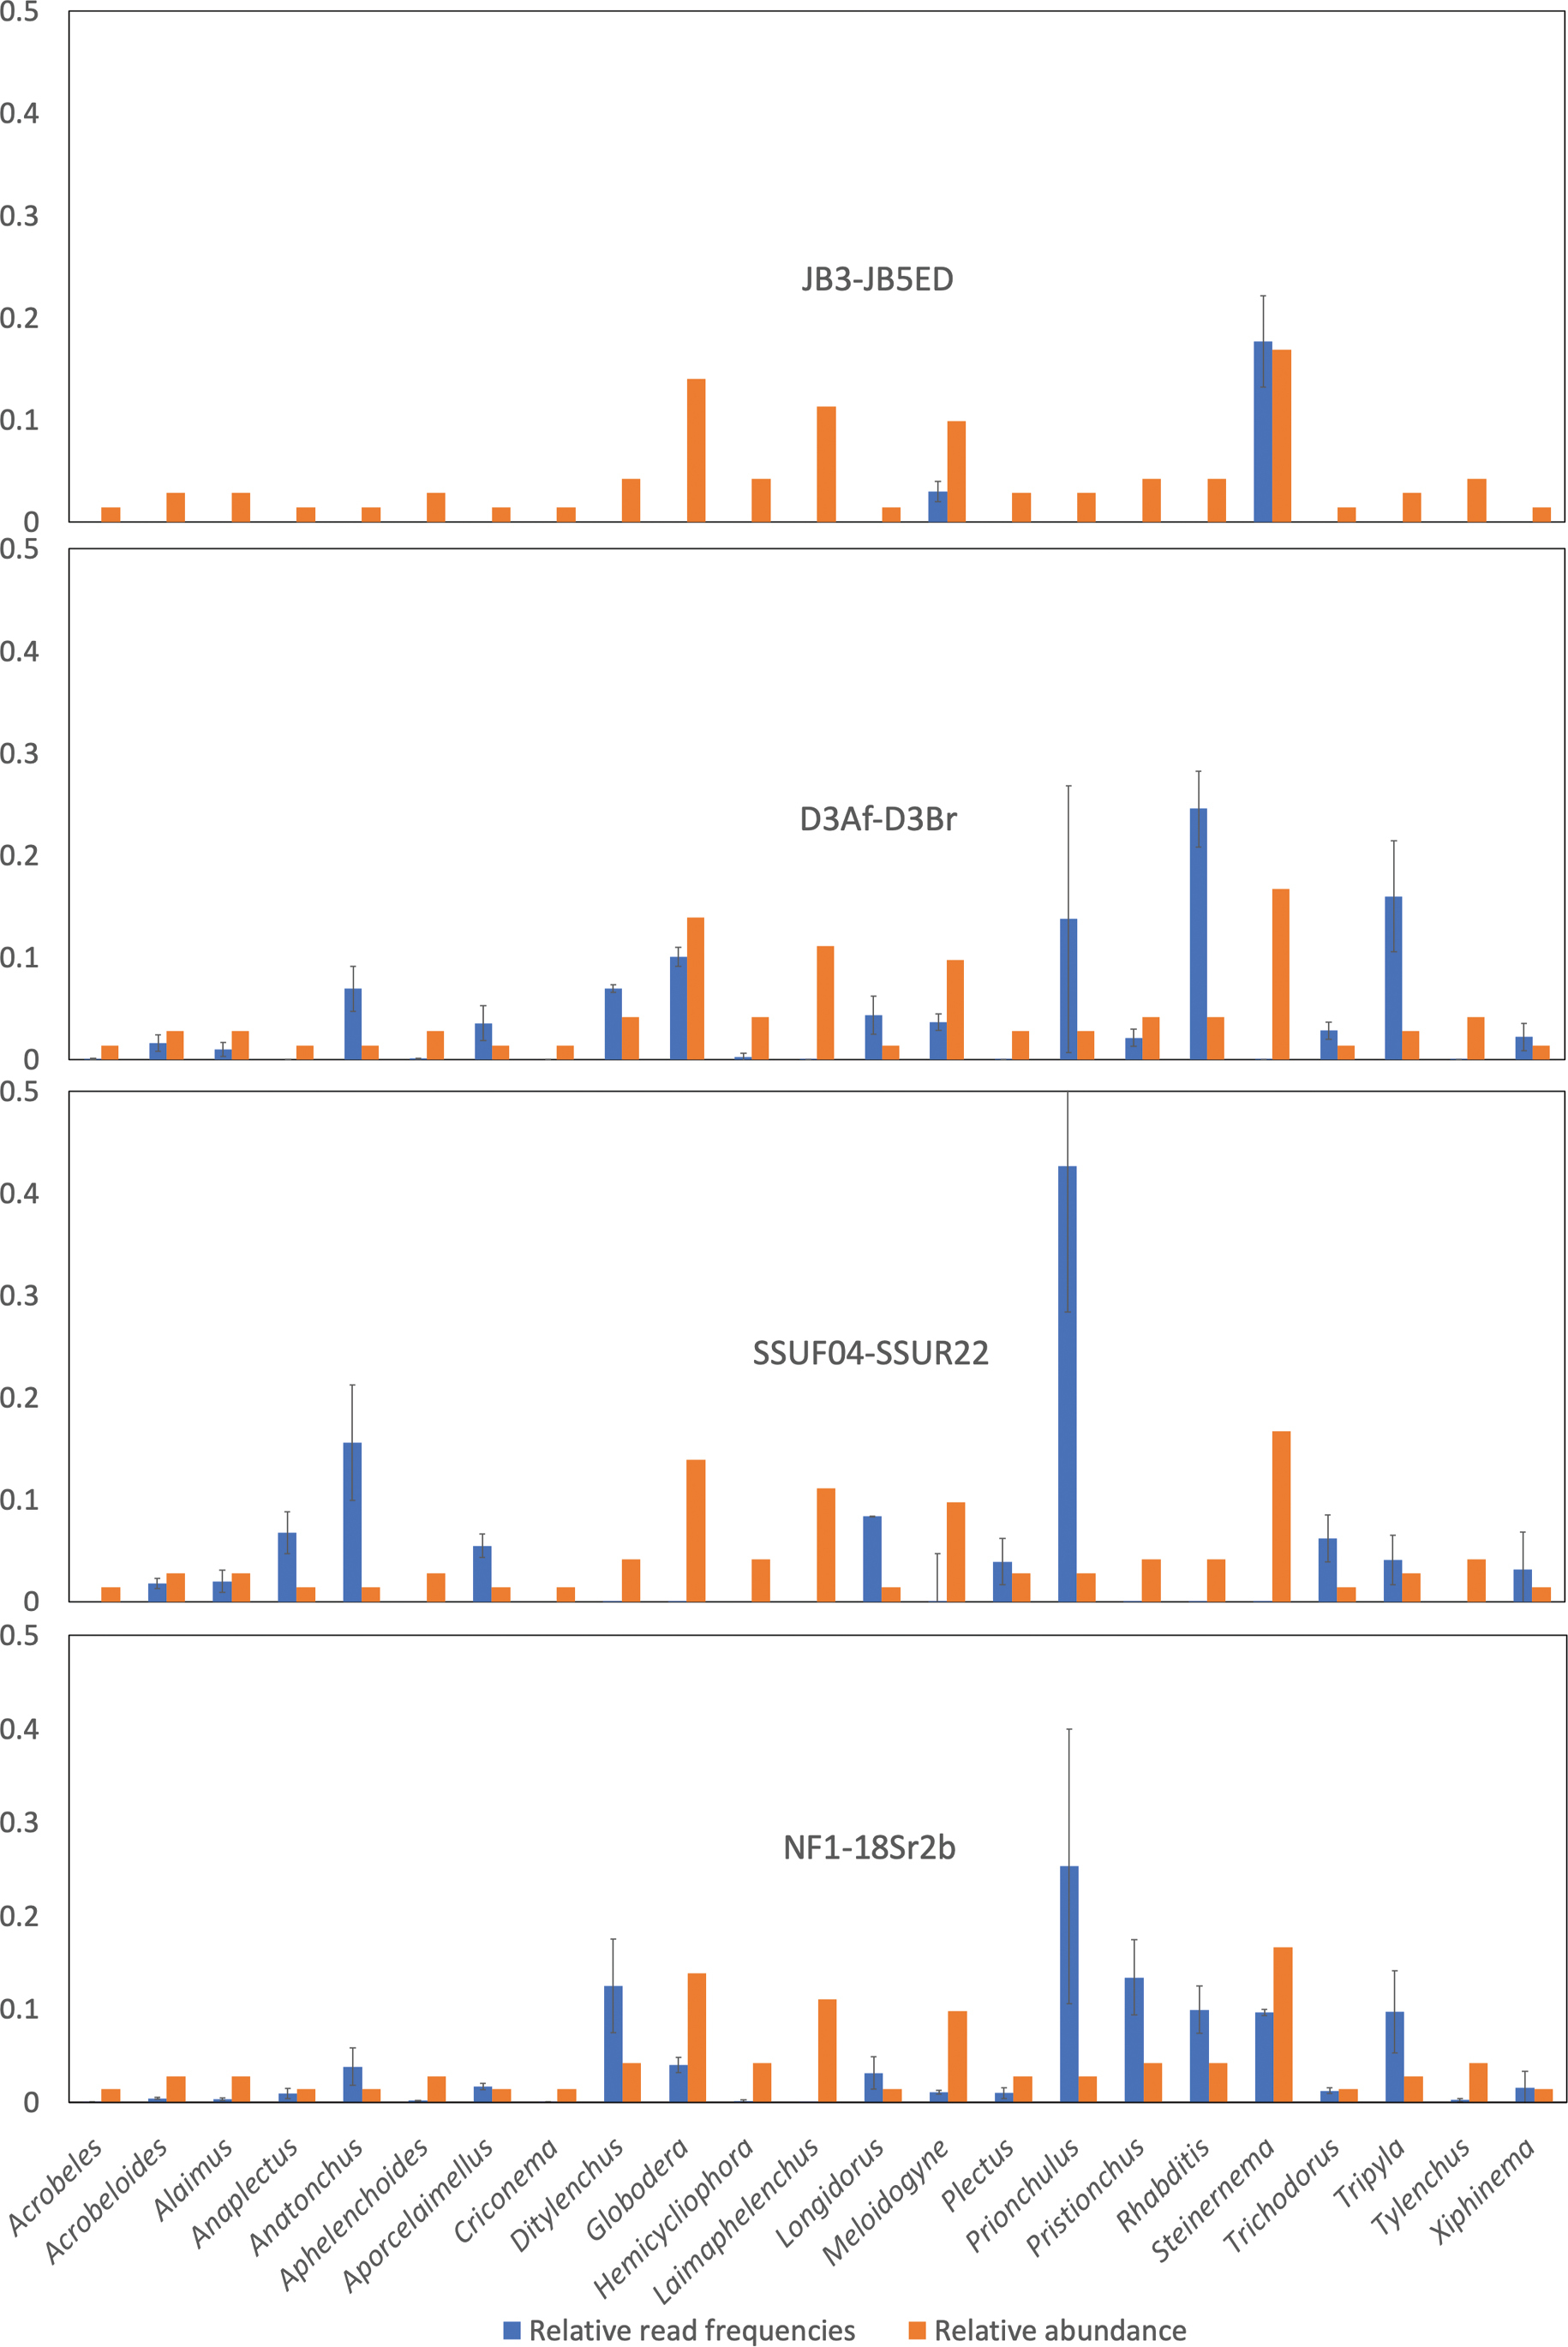
Comparison of the relative read frequencies and relative abundances of sampled taxa. Relative read frequencies are averages of the three replicates and error bars represent their standard deviations. Vertical axis represents proportion of the total number of reads or number of individuals. Blue bars represent relative read frequencies and orange bars represent relative abundance in the mock community. |