|
||
|
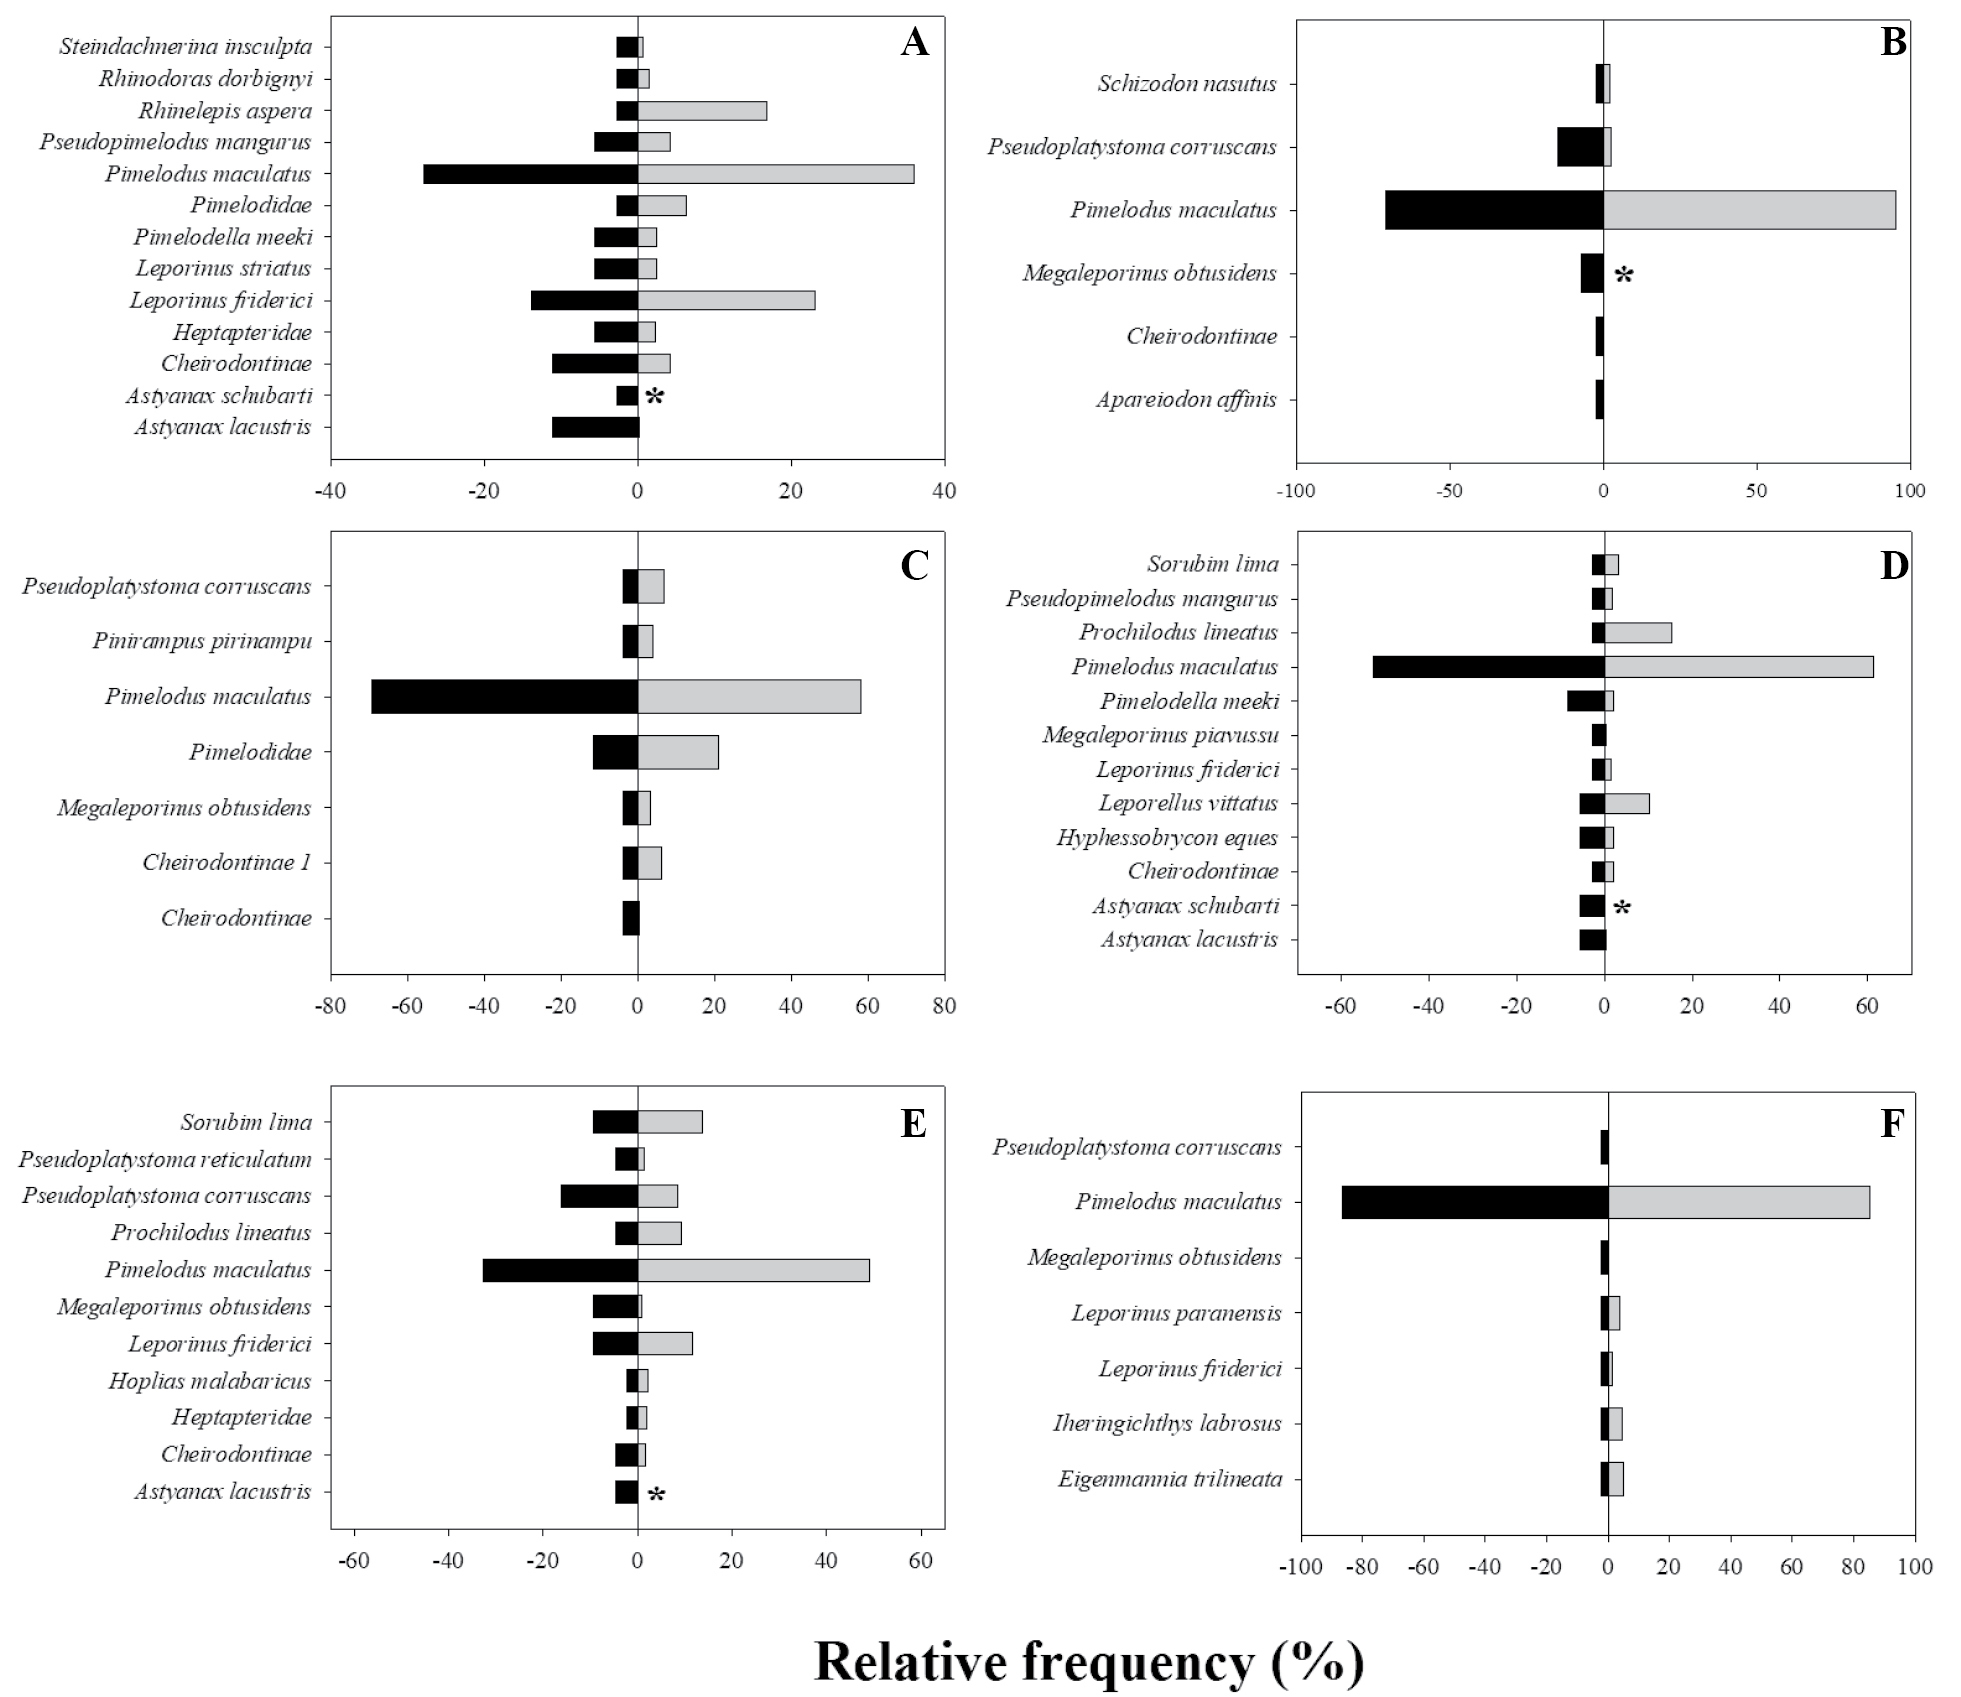
Graphic representation of species abundance proportion (%) between Sanger (x-axis, left side) and NGS (x-axis, right side) for analyzed samples. A: sample 1, B: sample 2, C: sample 3, D: sample 4, E: sample 5, F: sample 6.* = false negative. |
|
||||||||
| Part of: Nobile AB, Freitas-Souza D, Ruiz-Ruano FJ, Nobile MLMO, Costa GO, de Lima FP, Camacho JPM, Foresti F, Oliveira C (2019) DNA metabarcoding of Neotropical ichthyoplankton: Enabling high accuracy with lower cost. Metabarcoding and Metagenomics 3: e35060. https://doi.org/10.3897/mbmg.3.35060 |