|
||
|
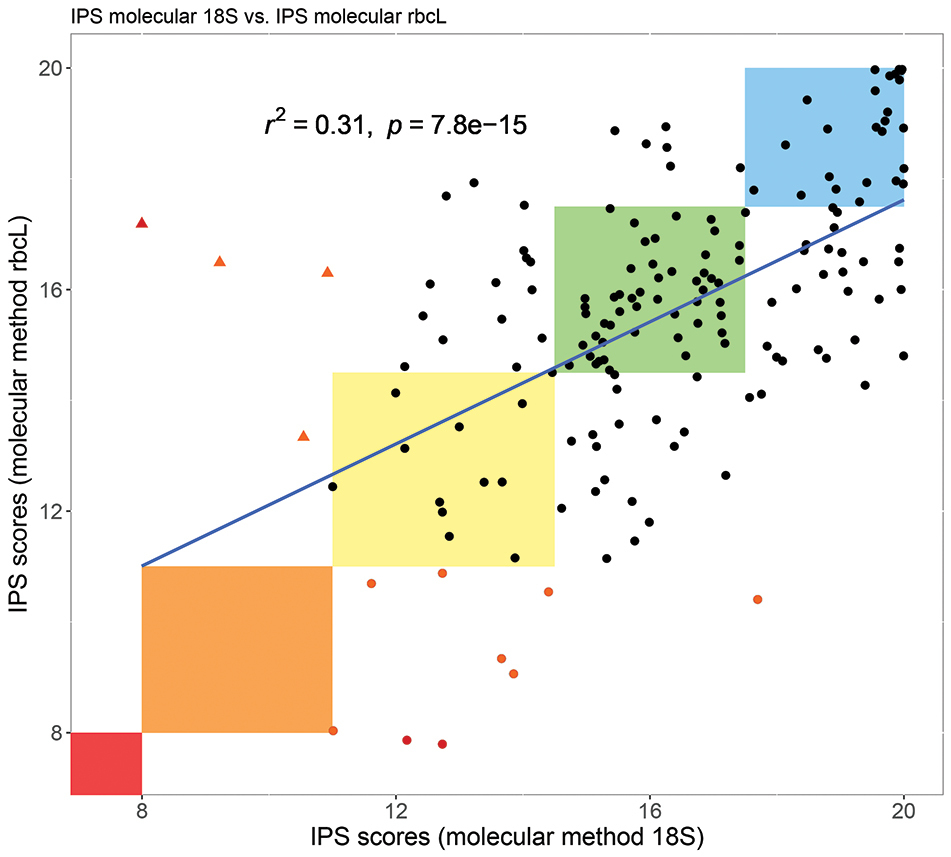
Correlation between the IPS scores obtained with the 18S and the rbcL markers. The boundaries for the ecological status classes defined by the IPS are indicated by the coloured squares (red=very bad, orange=bad, yellow=moderate, green=good, blue=very good). Red dots highlight “very bad” ecological status samples when using the rbcL marker and red triangles when using the 18S marker. Orange dots and triangles highlight “bad” ecological status samples using the rbcL and 18S markers, respectively. |