|
||
|
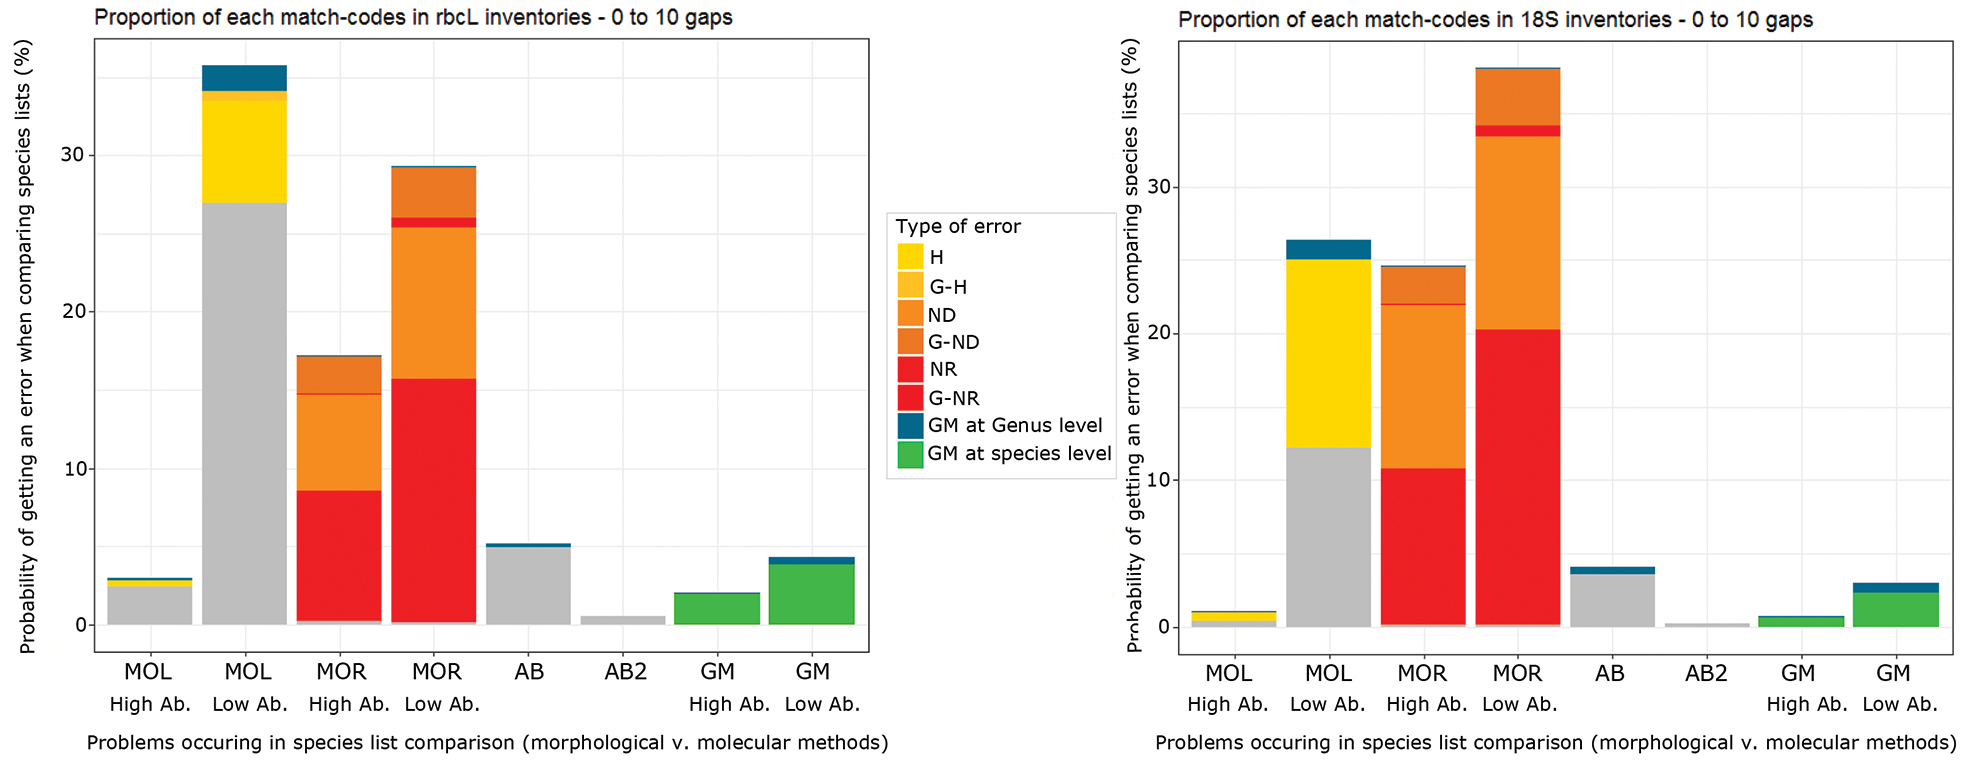
Average probability, per analysis, of a correct match or mismatch for a species identification and abundance assessment when comparing molecular and morphological methods. The code G represents a reference barcode stopping at the genus level; the yellow portion represents a species (H) or a genus (G-H) not expected in Fennoscandia; the orange portion represents the case when no DNA was detected for a species (ND) or a genus (G-ND) despite having a reference barcode in the database; the red portion represents the case when the database lacked a reference barcode for a species (NR) or a genus (G-NR). The green portion represents a good match both in presence and abundance of species, between the morphological and molecular assessments. |