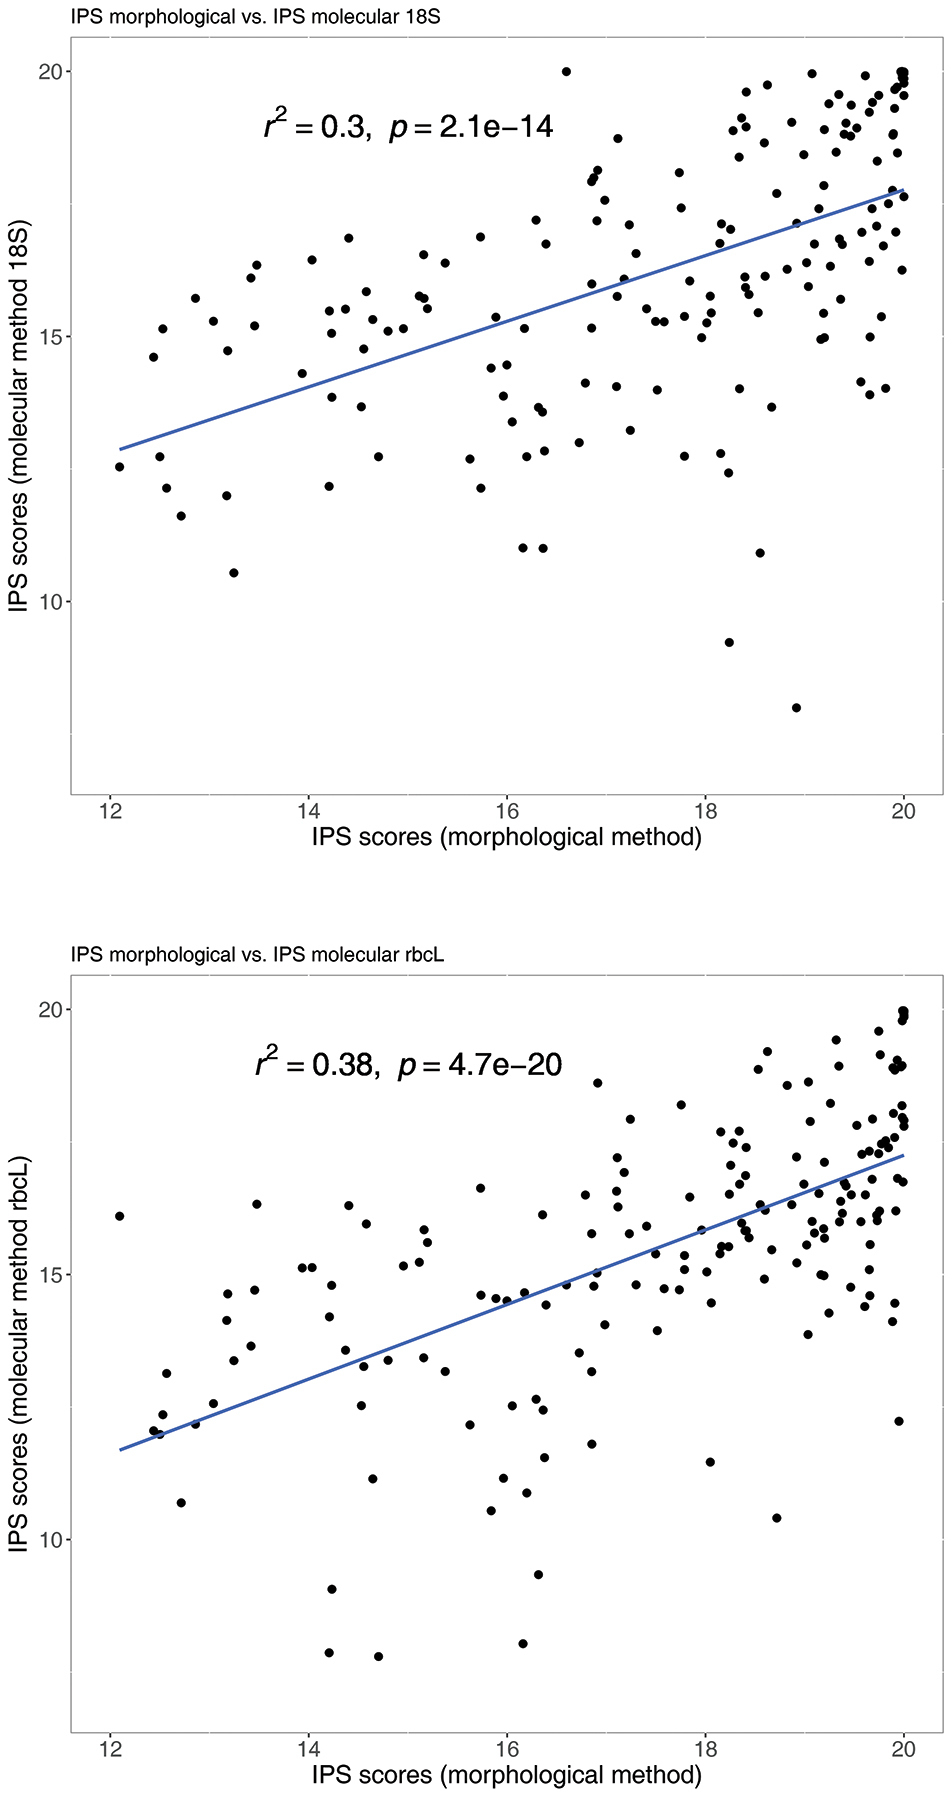
IPS scores correlation. The two axes show the IPS scores values of the samples assessed by the molecular (y-axis) or morphological method (x-axis). Increasing IPS scores values show increasingly good ecological status (IPS ≥ 17.5 = high, IPS ≤ 8 = bad).


  Part of: Bailet B, Bouchez A, Franc A, Frigerio J-M, Keck F, Karjalainen S-M, Rimet F, Schneider S, Kahlert M (2019) Molecular versus morphological data for benthic diatoms biomonitoring in Northern Europe freshwater and consequences for ecological status. Metabarcoding and Metagenomics 3: e34002. https://doi.org/10.3897/mbmg.3.34002