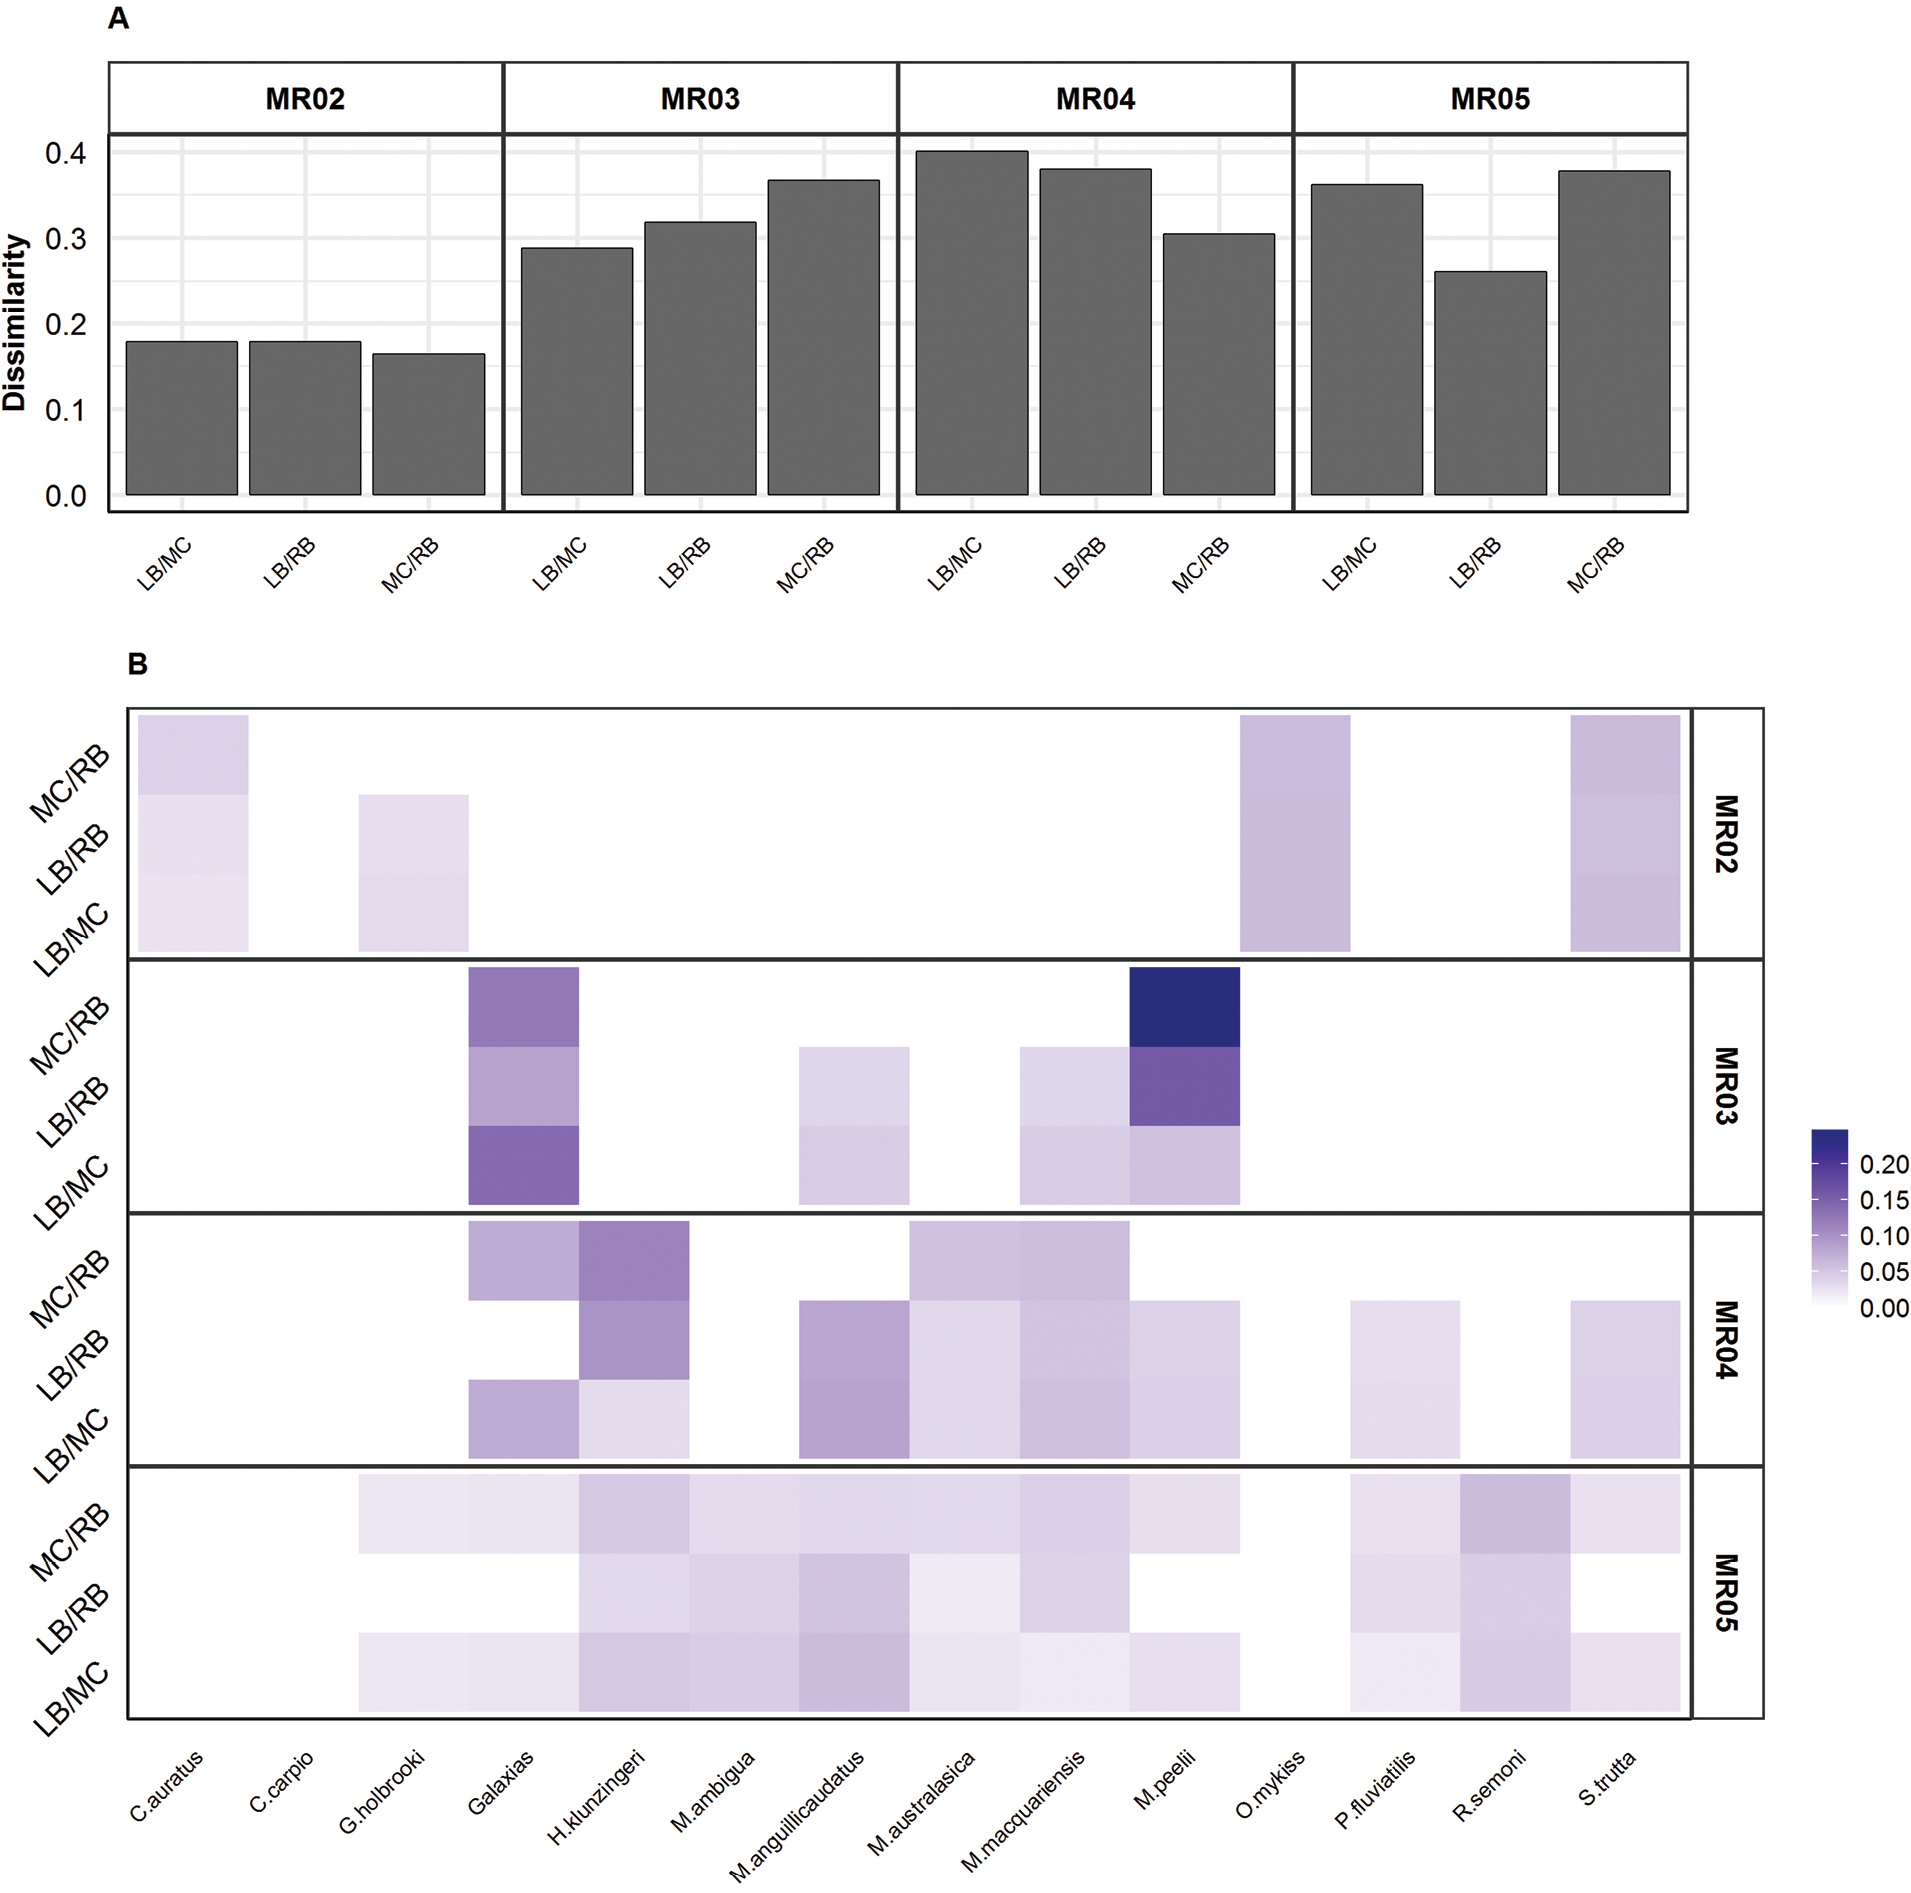
Overall dissimilarity between the fish community data obtained from the samples collected from the left bank (LB), mid-channel (MC) and right bank (RB) for the different sampling sites (A). The heat map shows the average contribution of each species to the overall community dissimilarity (B).


  Part of: Bylemans J, Gleeson DM, Lintermans M, Hardy CM, Beitzel M, Gilligan DM, Furlan EM (2018) Monitoring riverine fish communities through eDNA metabarcoding: determining optimal sampling strategies along an altitudinal and biodiversity gradient. Metabarcoding and Metagenomics 2: e30457. https://doi.org/10.3897/mbmg.2.30457