|
||
|
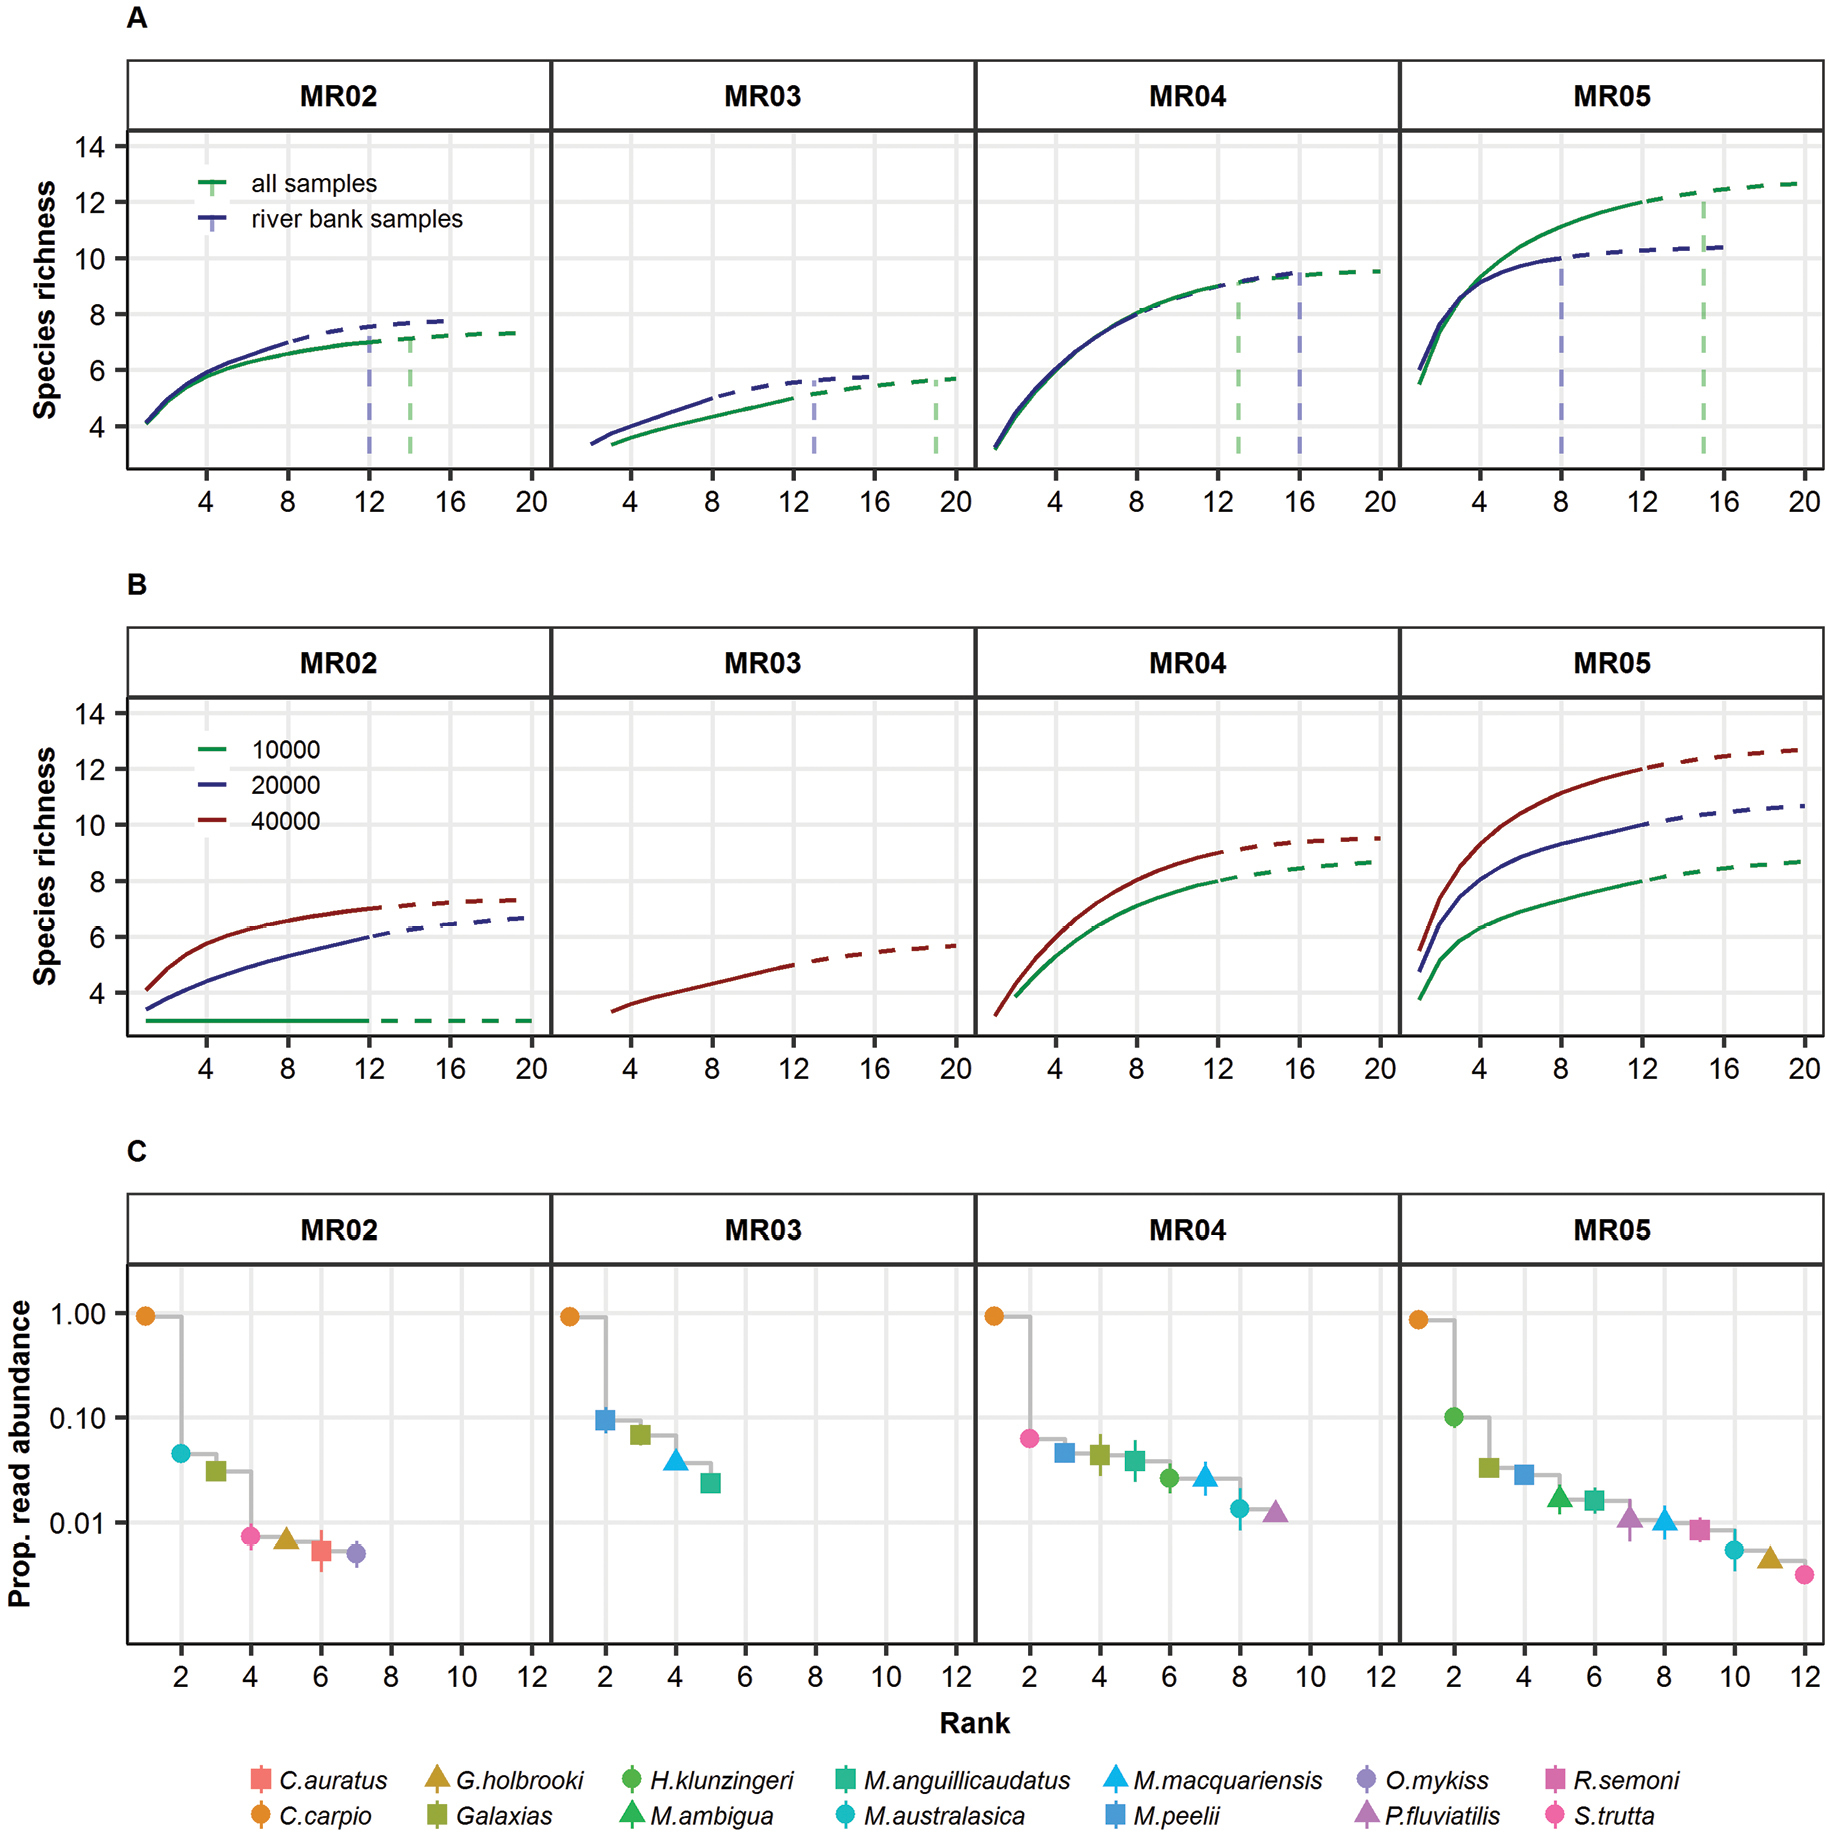
Species accumulation curves (SAC) (A–B) and rank abundance curves (RAC) (C) for the four most downstream sampling sites in the Murrumbidgee River. SAC were constructed to compare two different sampling strategies (A) (i.e. using all available samples and only samples collected from the river-banks) and different sequencing depths (B). The vertical dashed lines in panel A show the number of samples needed to detect ≥ 95% of the estimated species richness (i.e. based on the Chao2 estimates) for each site and sampling strategy. |