|
||
|
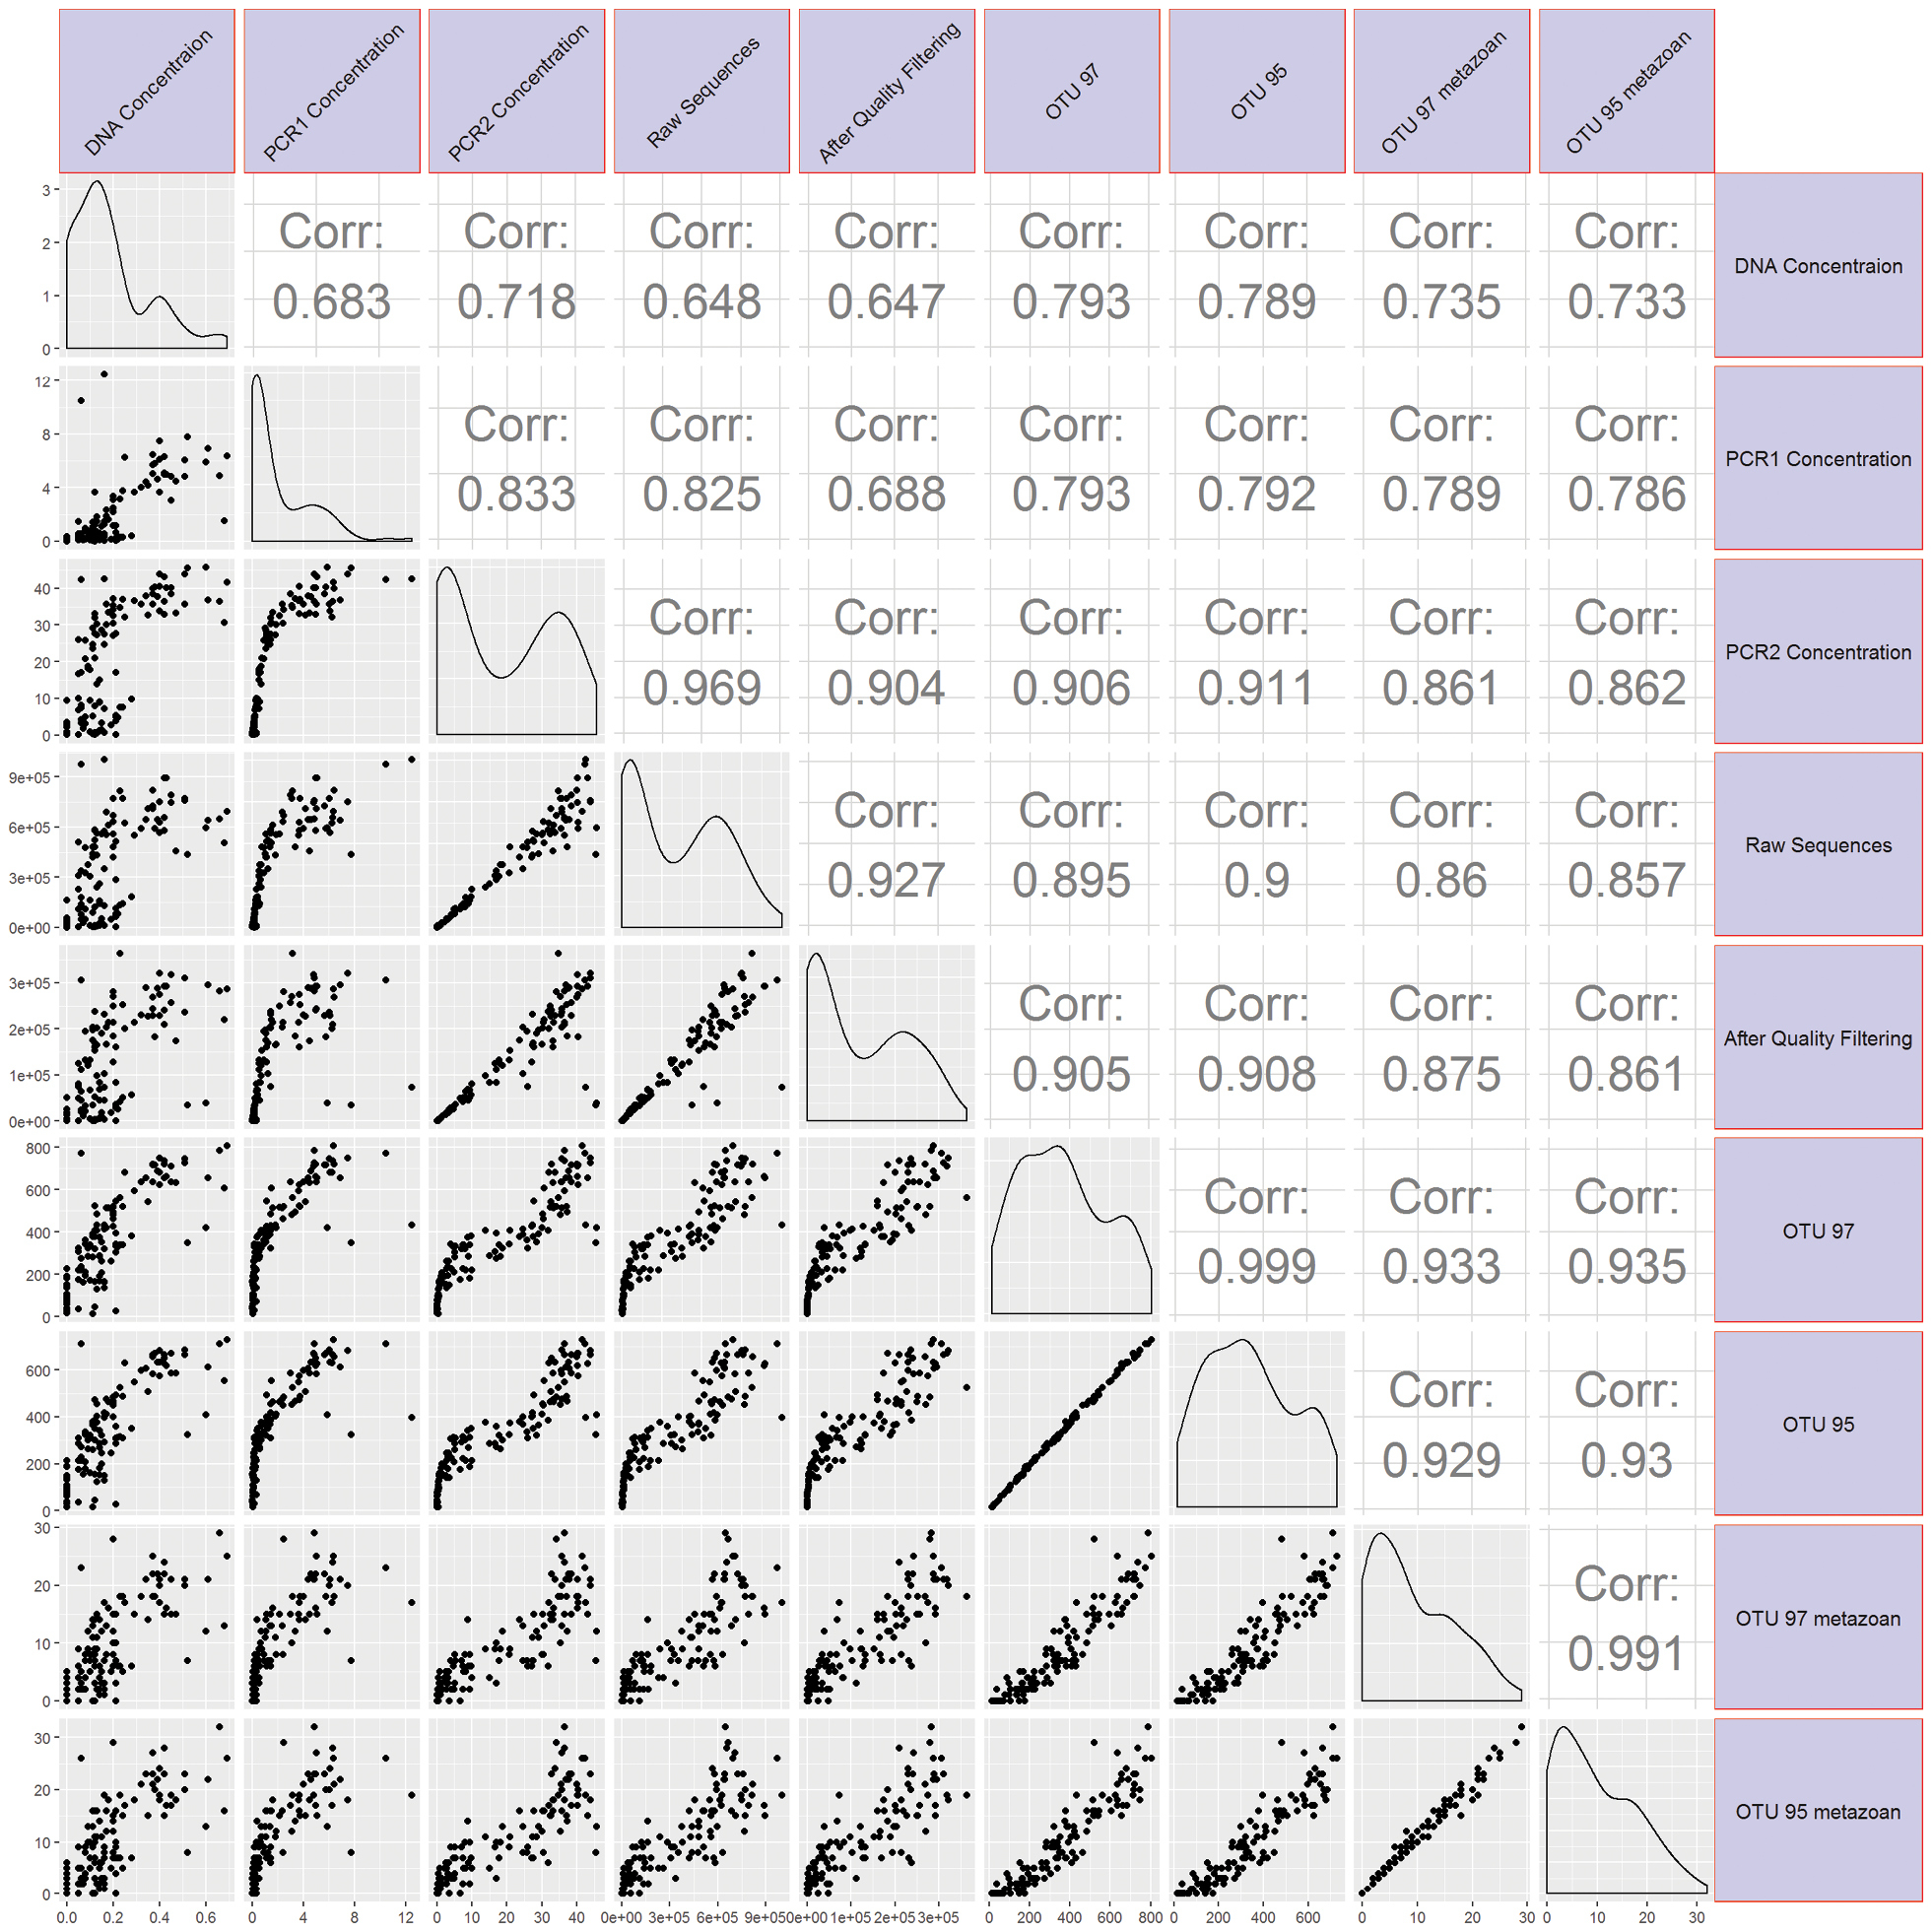
Pairwise correlations between non-independent response variables corresponding to quantified values taken during the analyses. Lower triangle consists of scatterplots with individual sample comparisons shown. The upper triangle shows the R correlation value corresponding with the lower triangle. The diagonal shows the distribution curve for the variable indicated in the corresponding column. |