|
||
|
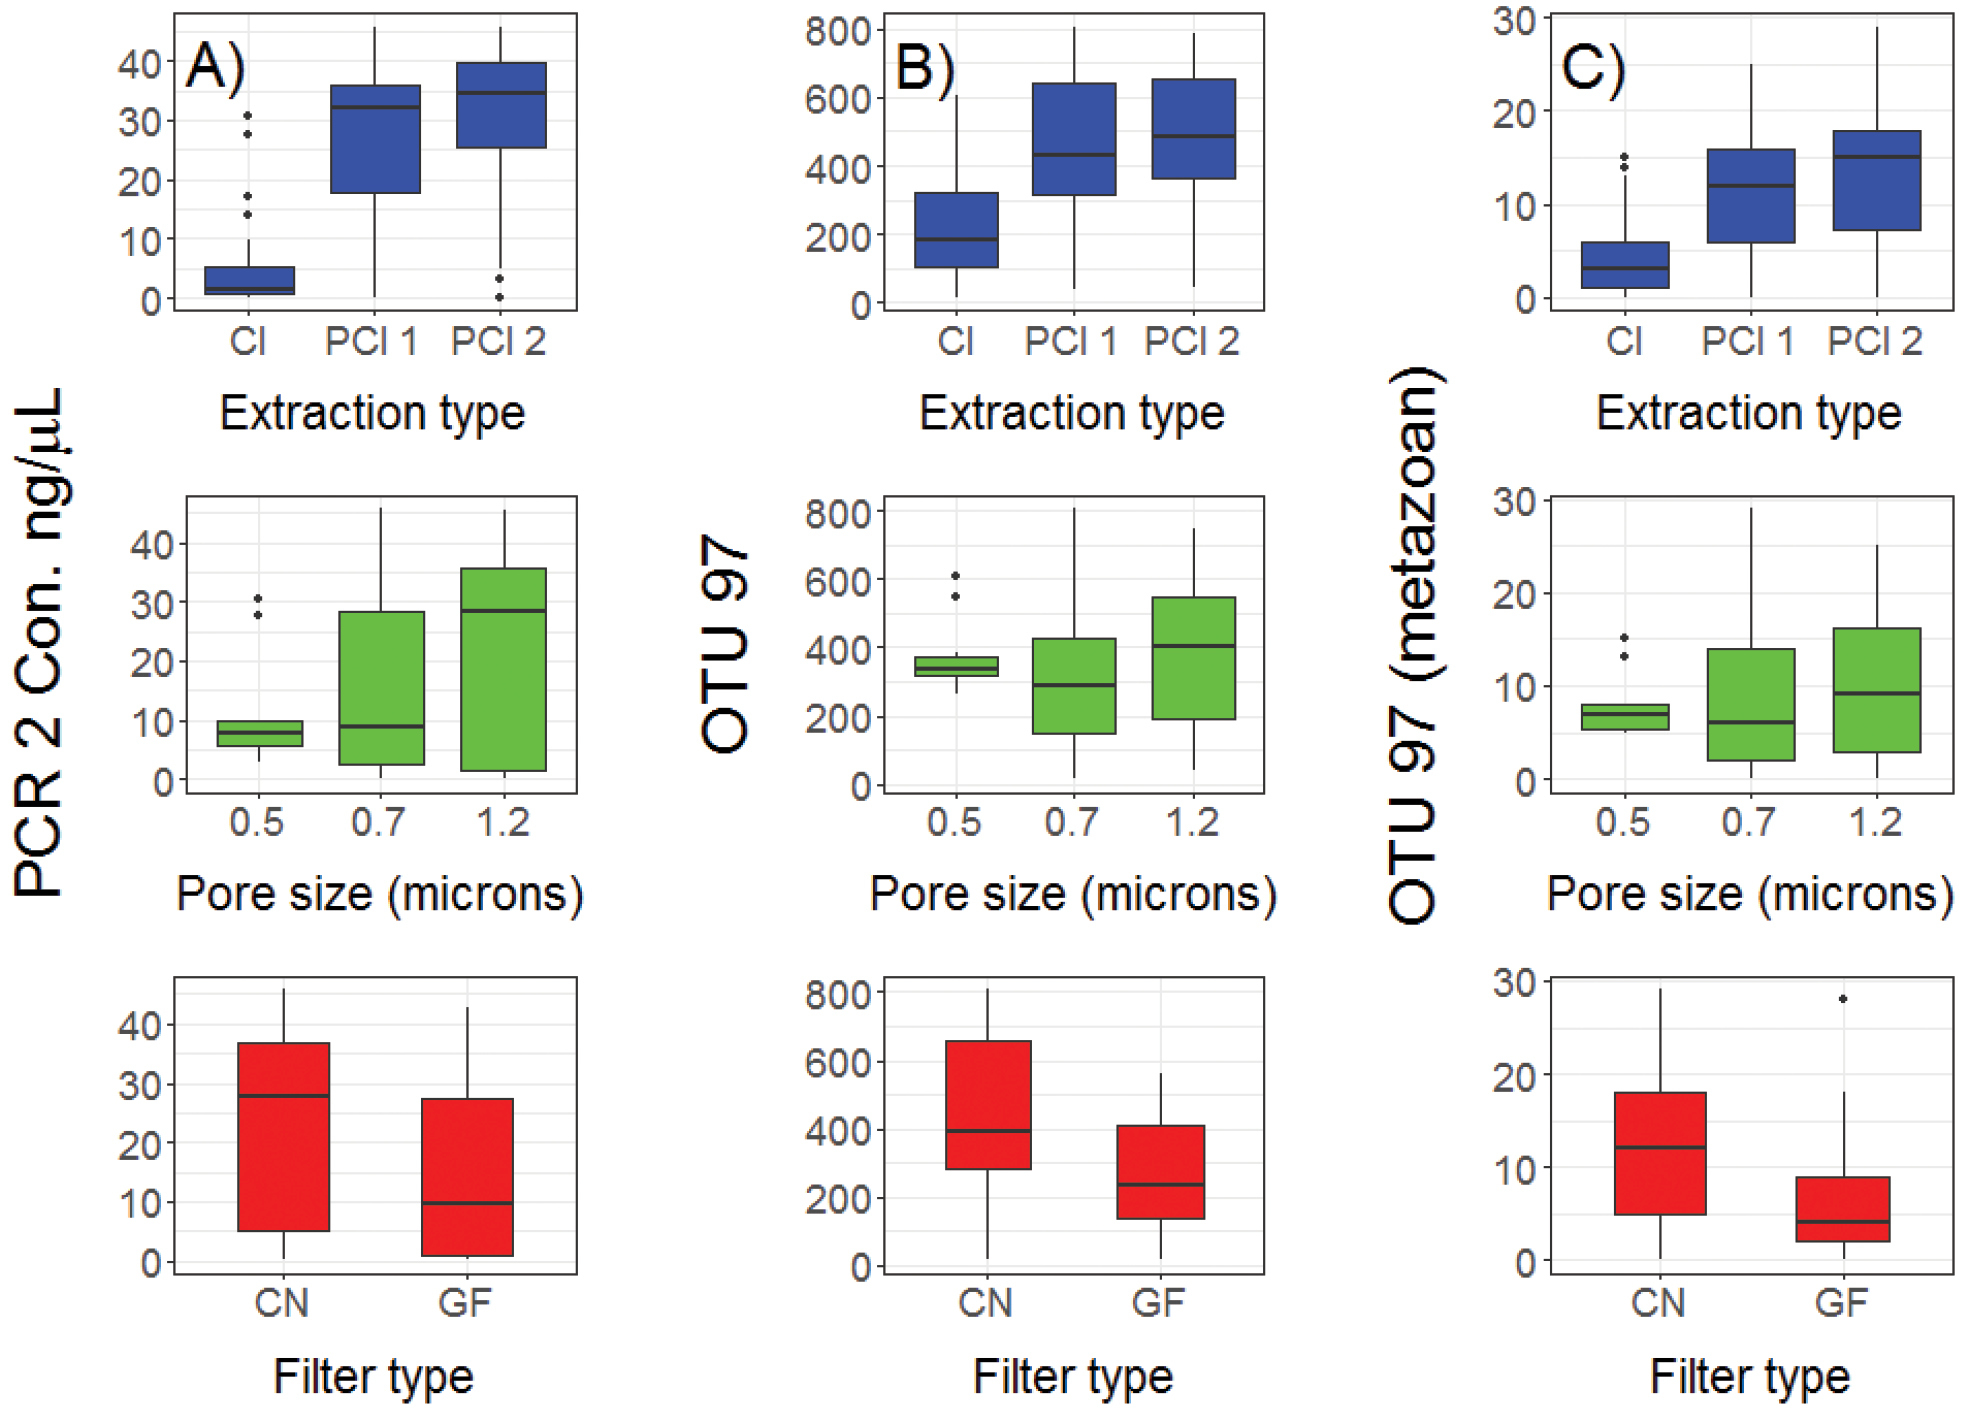
Observed DNA concentrations or number of Operational Taxonomic Units by experimental factor. Mean PCR-2 DNA concentrations (indexed libraries) (y-axis) for each set of explanatory variables including extraction type (A), filter pore size (B) and filter material (C). Extraction types include chloroform (Cl), phenol chloroform 1 (PCl 1) and phenol chloroform 2 (PCl 2) extractions. Filter materials included Cellulose Nitrate (CN) and Glass Fibre (GF). The upper and lower whiskers indicate the minimum and maximum point within 1.5 times the Interquartile Range extended from the 25th and 75th percentile, respectively. |