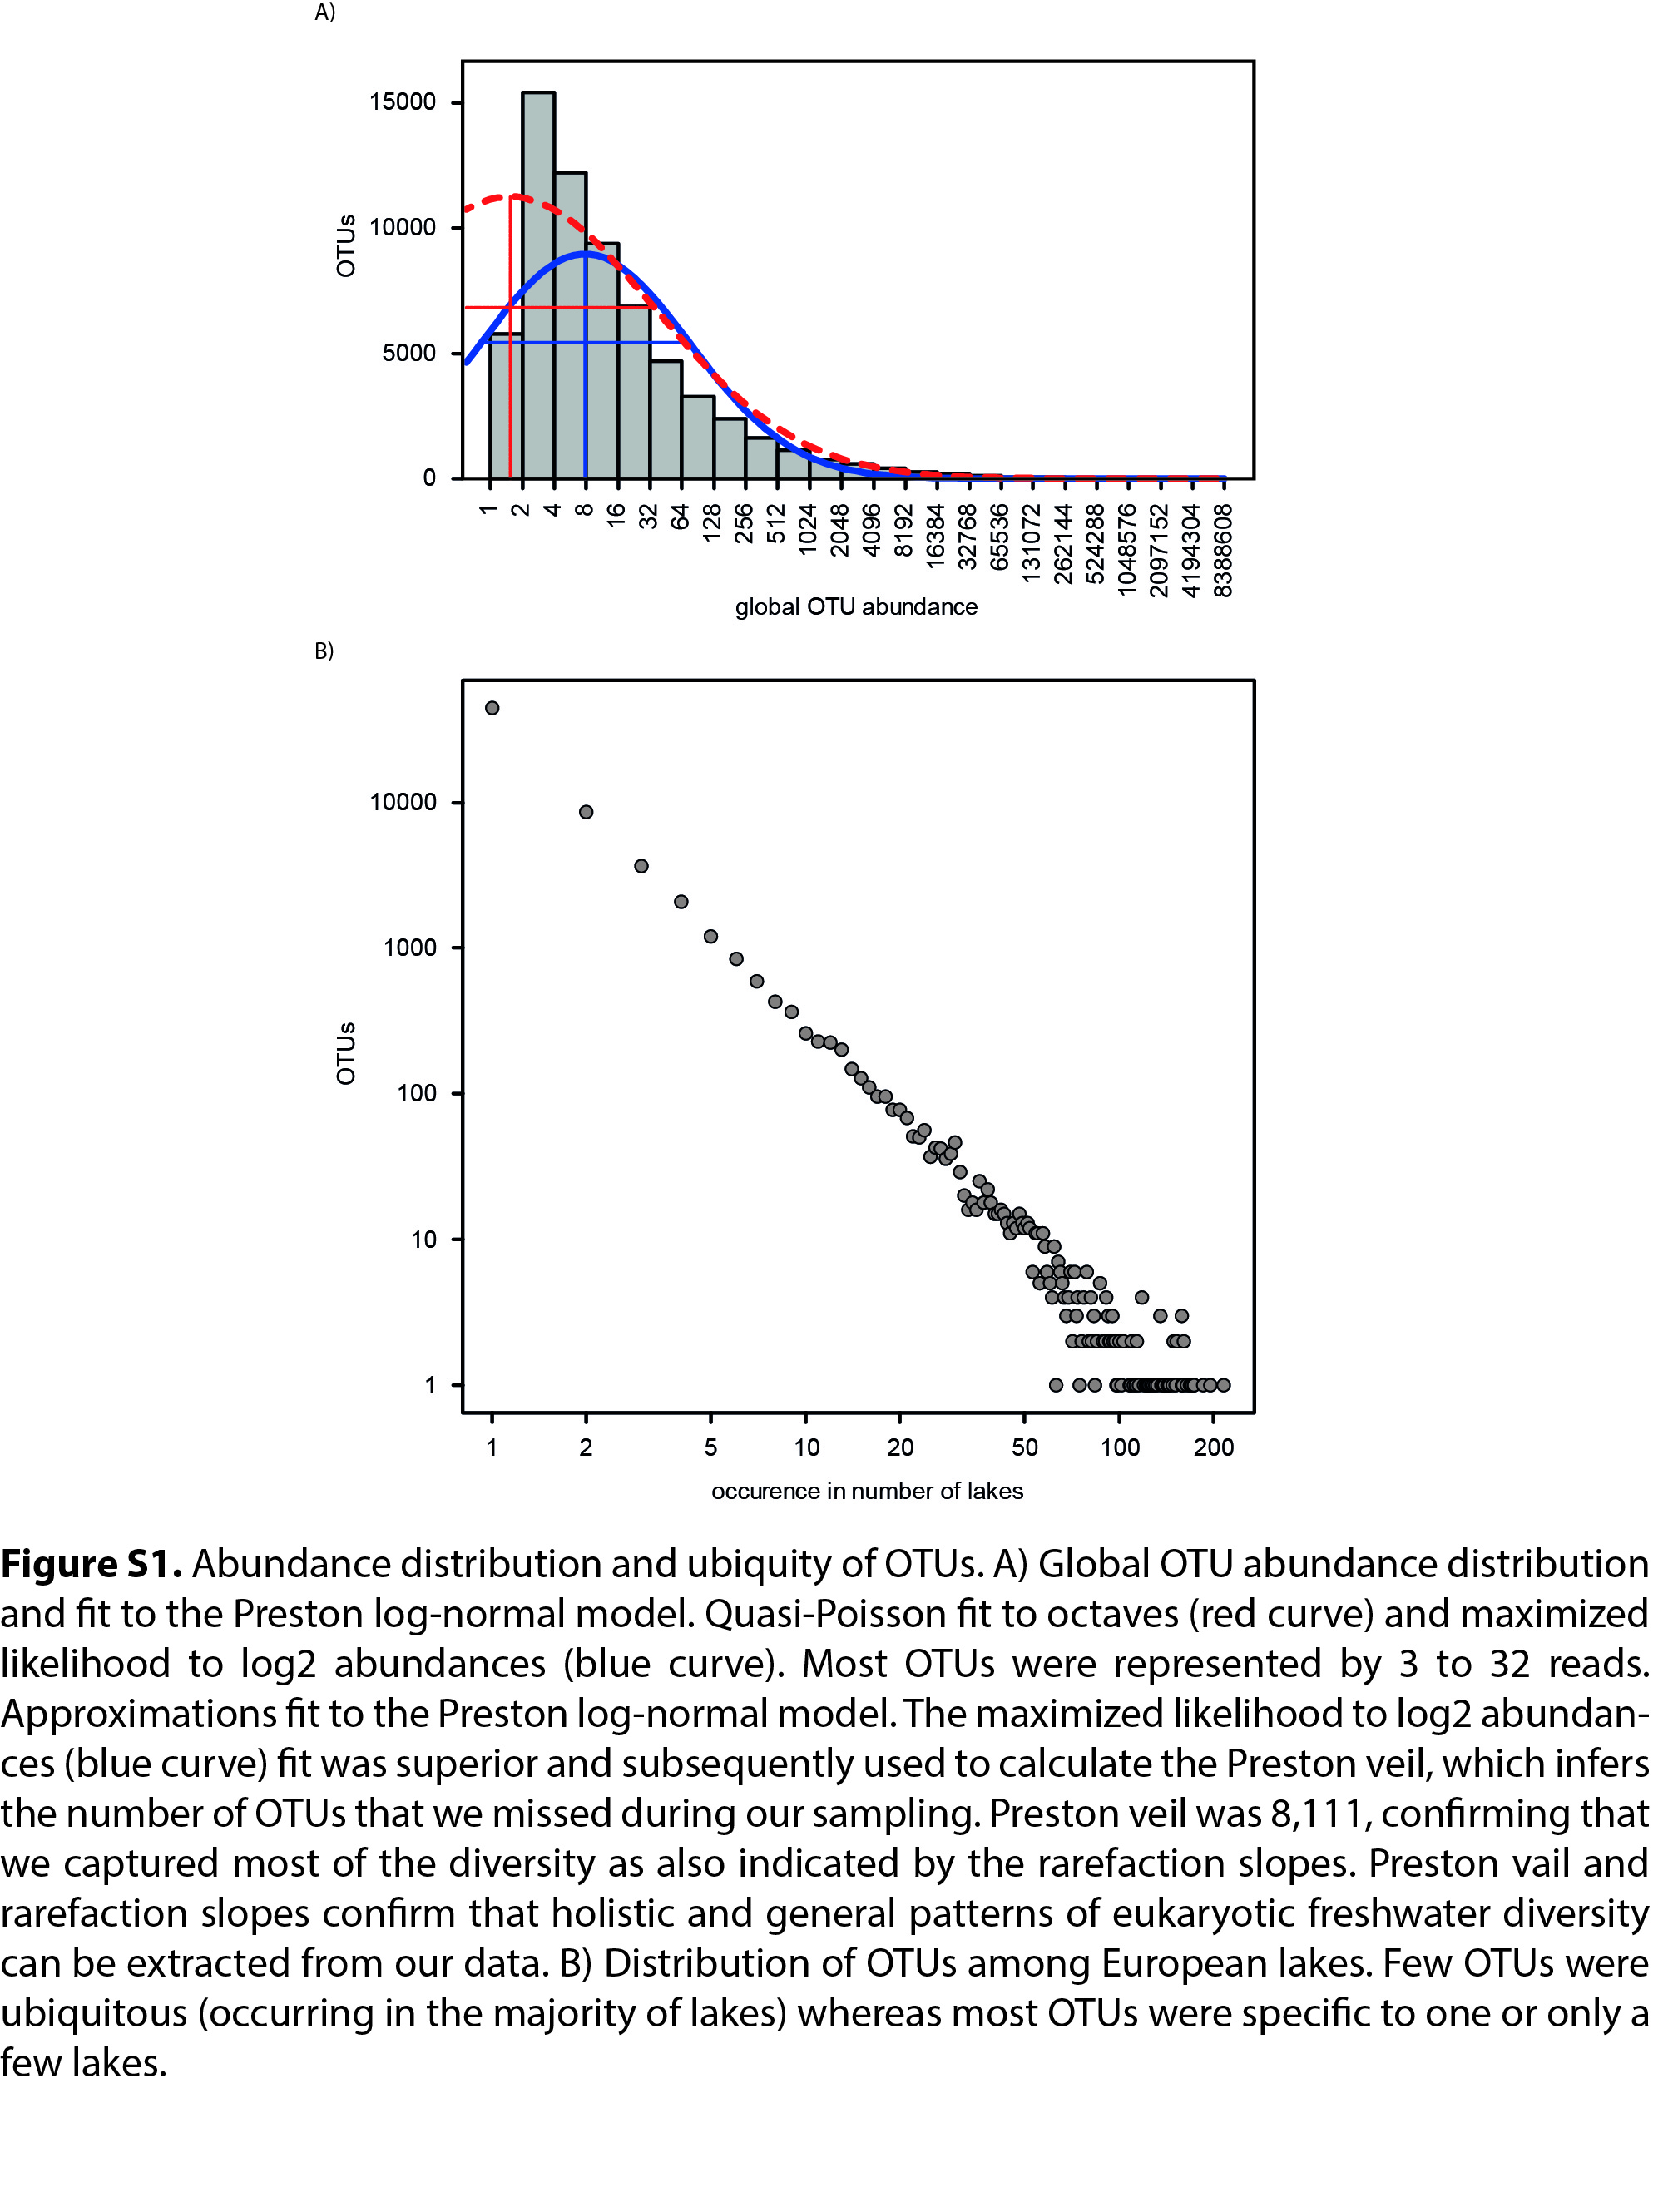
Abundance distribution and ubiquity of OTUs. A) Global OTU abundance distribution and fit to the Preston log-normal model. Quasi-Poisson fit to octaves (red curve) and maximized likelihood to log2 abundances (blue curve). Most OTUs were represented by 3 to 32 reads. Approximations fit to the Preston log-normal model. The maximized likelihood to log2 abundances (blue curve) fit was superior and subsequently used to calculate the Preston veil, which infers the number of OTUs that we missed during our sampling. Preston veil was 8,111, confirming that we captured most of the diversity as also indicated by the rarefaction slopes. Preston vail and rarefaction slopes confirm that holistic and general patterns of eukaryotic freshwater diversity can be extracted from our data. The unit of the y-axis is the number of OTUs B) Distribution of OTUs among European lakes. Few OTUs were ubiquitous (occurring in the majority of lakes) whereas most OTUs were specific to one or only a few lakes. Unit of y-axis as in a).